Analysis (Introduction)
Type of Analysis
When it comes to investing or trading the global markets, there is no shortage of analysis. There are a lot of ways to analyze a stock or a currency. If you search the term “forex market analysis” you will get over one billion results on google. However, there are three main types of analysis that everyone uses.
- Fundamental Analysis
- Technical Analysis
- Sentiment Analysis
Fundamental Analysis
If you are trading stocks, then the goal of fundamental analysis is to determine how a company’s financial status is, and whether the company’s future value is accurately reflected in its current stock price.
While in Fx, the fundamental analysis includes different metrics, as there are no financial statements for a currency, but there are a lot of data that will determine the future and the present value of a currency, which include the economic data of a country that is related to any currency you are trading or willing to trade.
Such data includes GDP, unemployment rate, inflation rate, wage growth, trade balance, and more. In addition, traders should always follow the central bank’s policies as they always have the biggest effect on the local currency.
Technical Analysis
Technical analysis relay on charts only, it evaluates the recent movements and trends to attempt to determine what’s next for a currency price. Generally, technical analysts pay less attention to the fundamentals.
For example, technical analysts look for past movements and try to predict future moves. For example, they might look for support levels and resistance levels when assessing a currency’s next move. in short, everything is on the chart.
Type of Charts
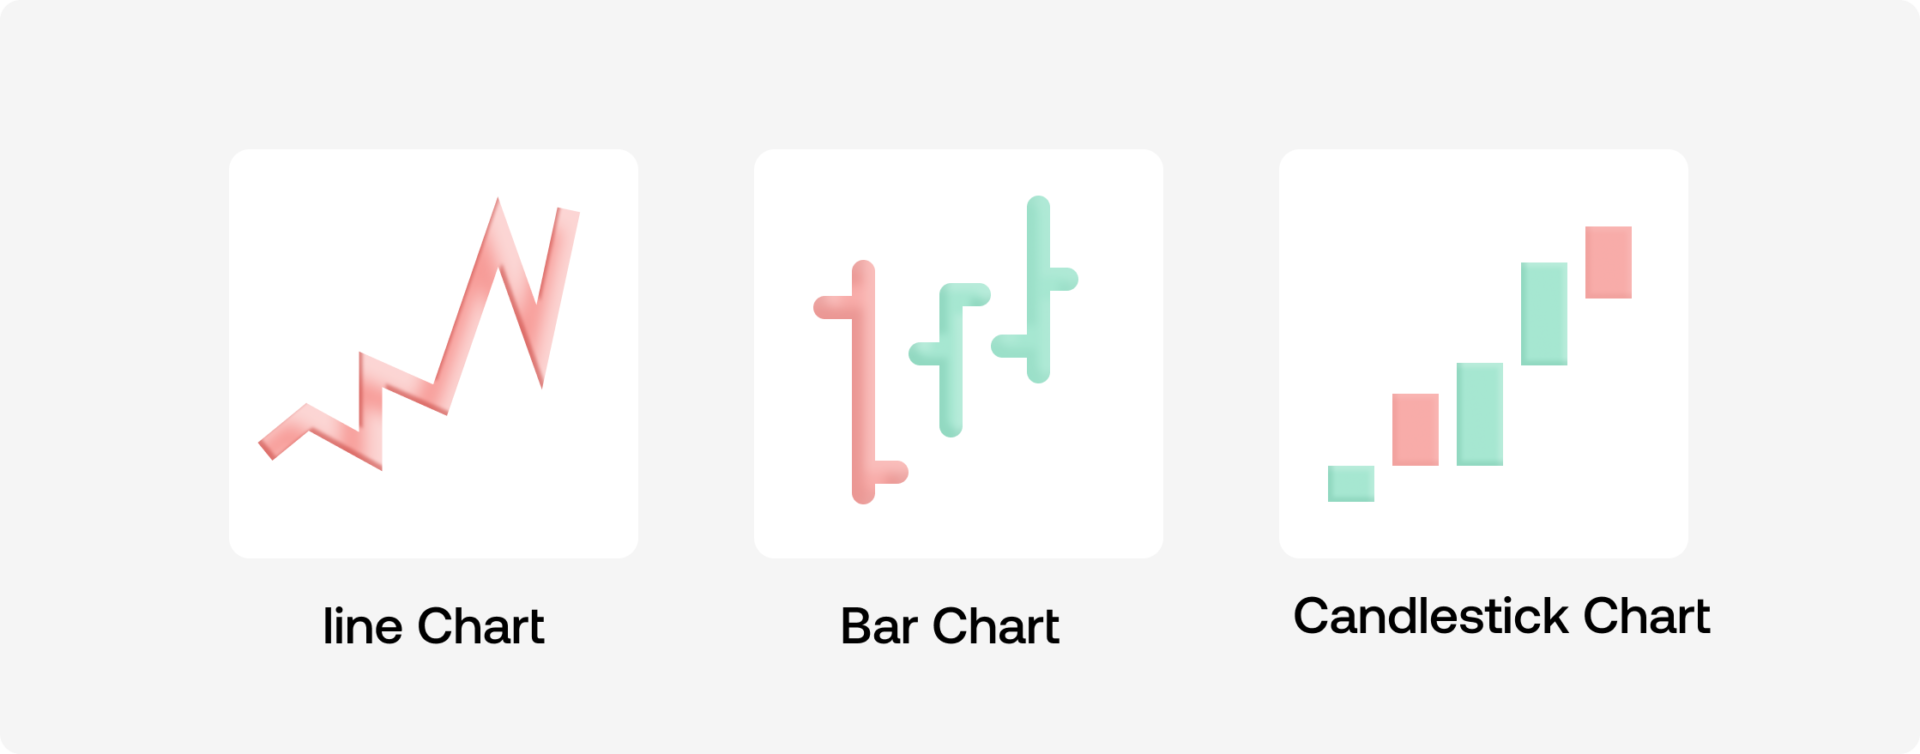
There is a wide range of charts that trader uses on a daily basis. None of these is perfect. Some traders also use multiple types of charts before taking a decision. The more information you can gather, the better. Below are the most used charts.
- Line Chart
- Bar Chart
- Candlesticks Chart
What is Support?
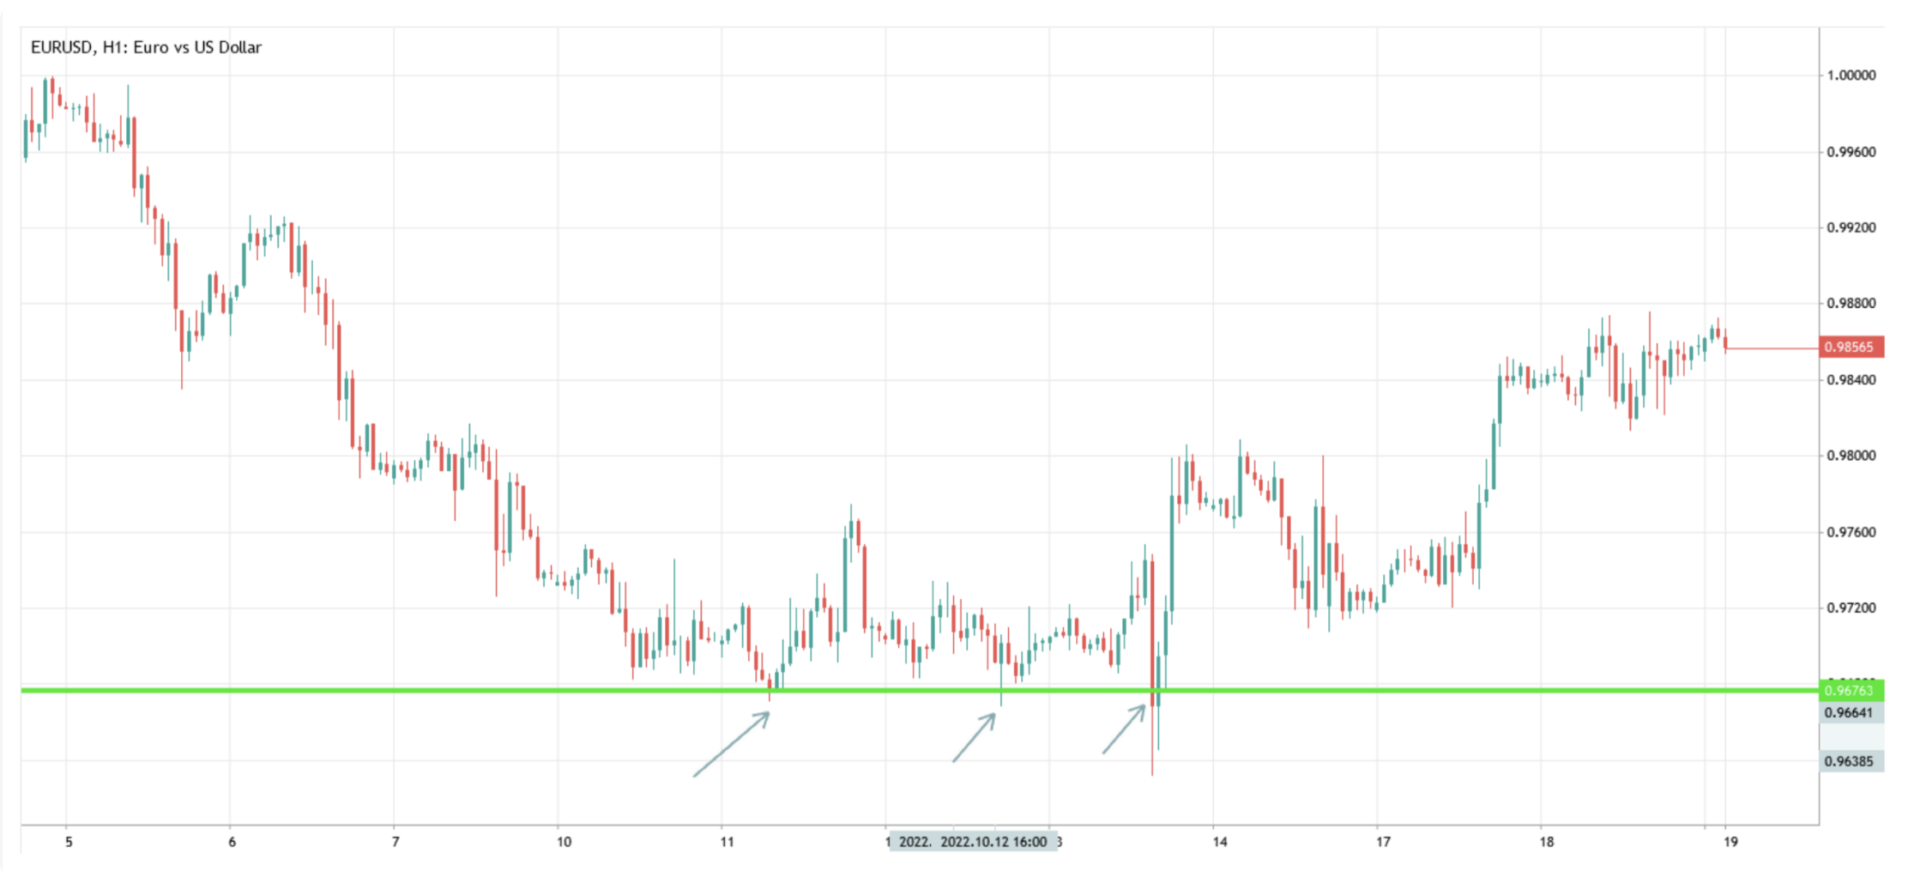
Let’s say that the Euro has been declining for the past few hours, and at some point, the downside pressure has eased, and the pair started to trade within a range.
Notice how the Euro managed to hold the same level for a few hours without breaking lower before it started to rise again. When the price bounces off the same area multiple times, this is called support. All support areas are determined by looking at the past. For example, if the Euro bounced from 1.1100 against the dollar in 2020, it will most likely bounce off the same level in the future.
What Happens When Support Is Broken?
Generally speaking, when a currency trade around a support area, analysts would be watching for a possible bounce. But what happens if it breaks lower against their expectations? That support is no longer valid, and the currency is most likely to decline to the next support area.
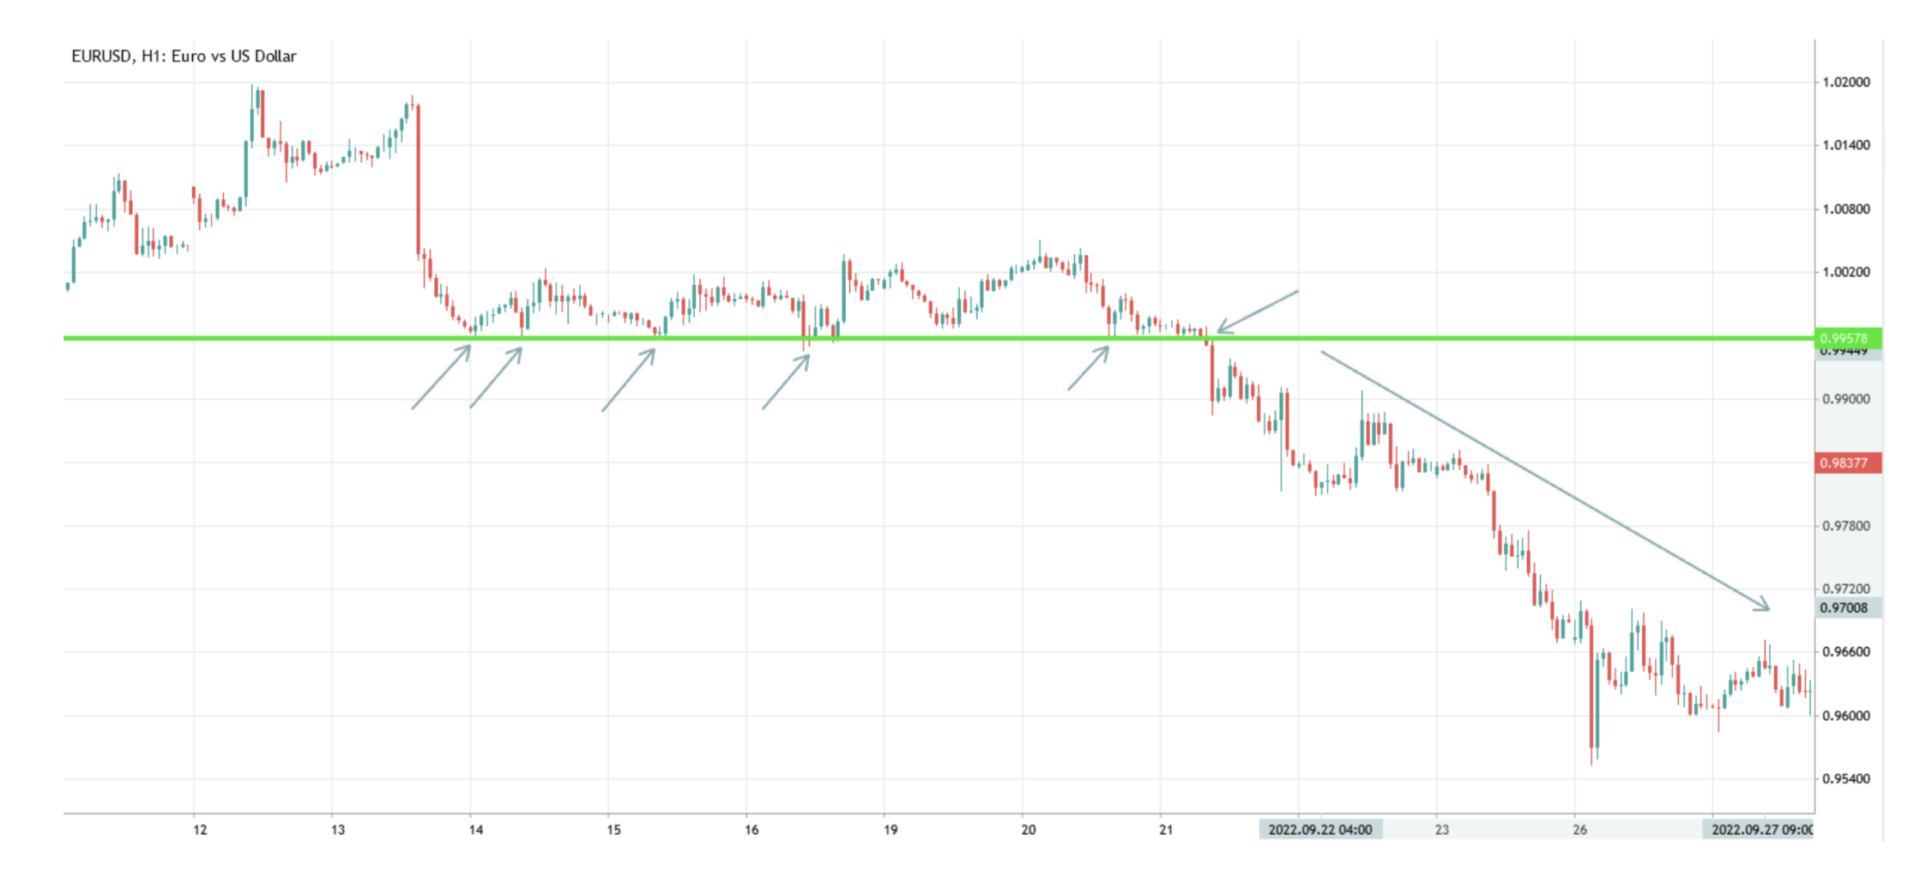
In the example above, notice how the Euro bounced off its support around 0.9955 multiple times but was unable to show a clear and sustainable strength, leading the currency to decline back and breach that support. Once that support is broken, the downside pressure accelerated.
What is Resistance?
Resistance is the opposite of support. A currency would be in an uptrend on high demand, but it reaches a level where it starts to lose some steam. It fails to break certain areas multiple times before it declines back. Check the chart below.
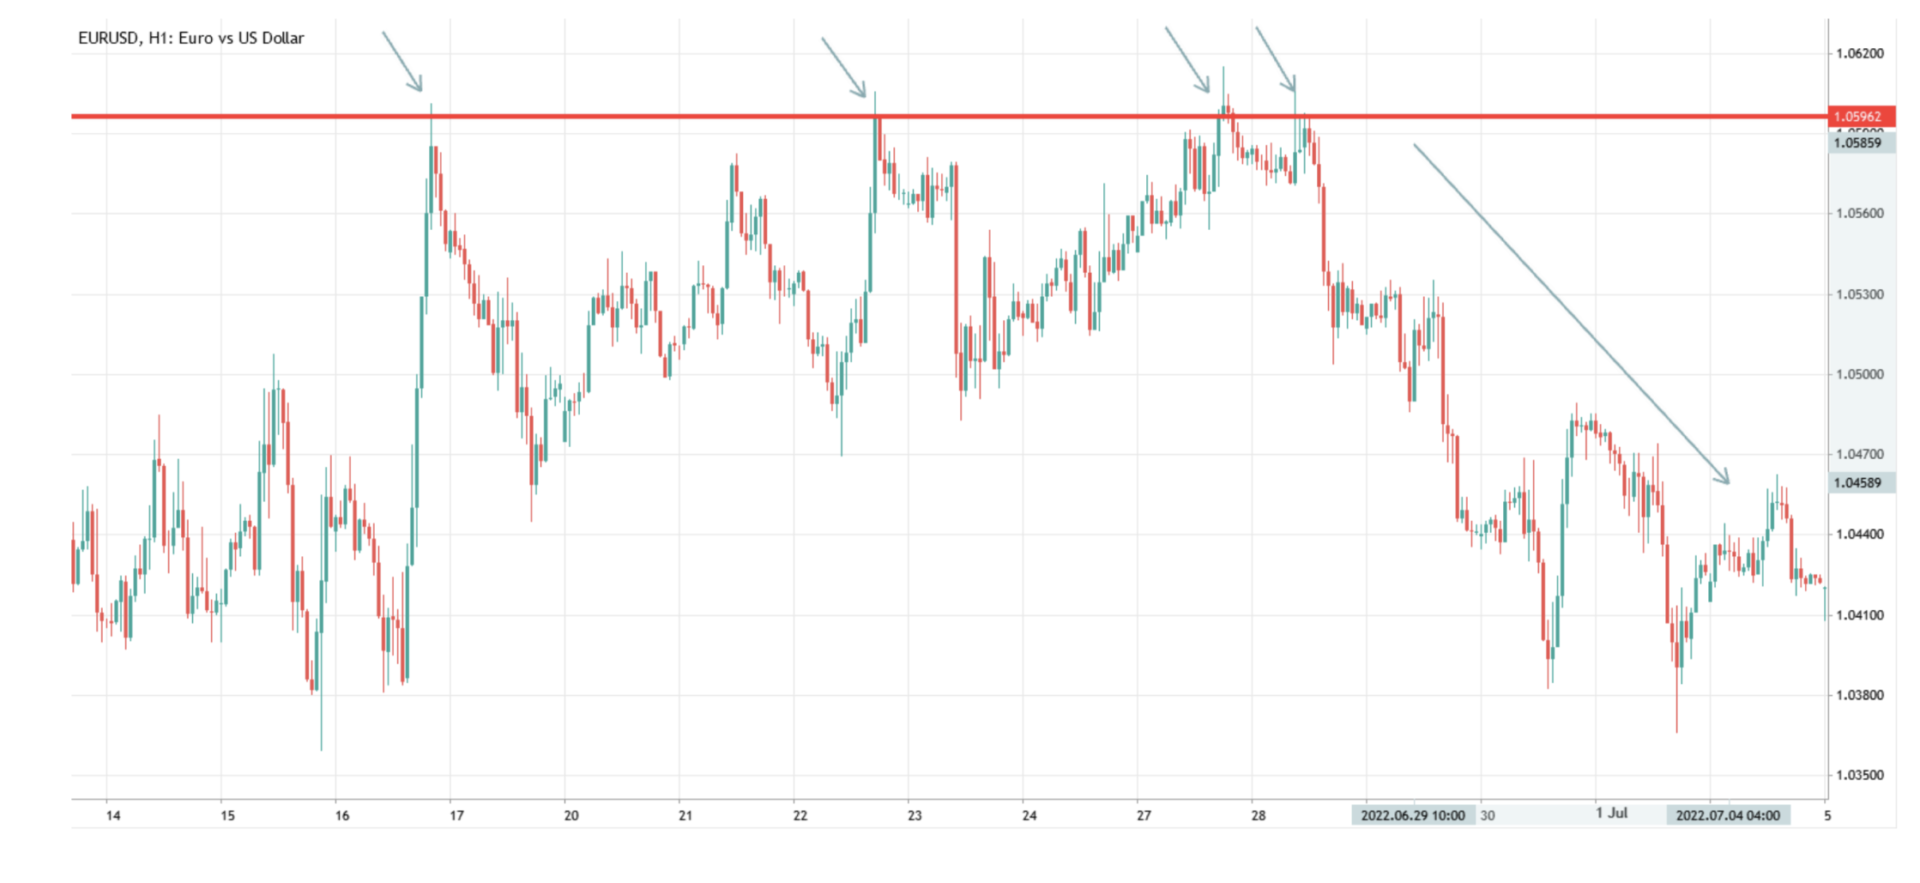
Notice how the price rallied up within a few hours, then it failed to continue with such a move and kept getting a notable resistance for a few days before the pair gave up all the gains and returned to where it was before the uptrend occurred.
What Happens When Resistance is Broken?
The same idea of broken support, but the opposite. Once the pair succeeded in breaking a resistance area and holding above it for a few hours, this would usually lead to another move higher to a new resistance area. Check the chart below.
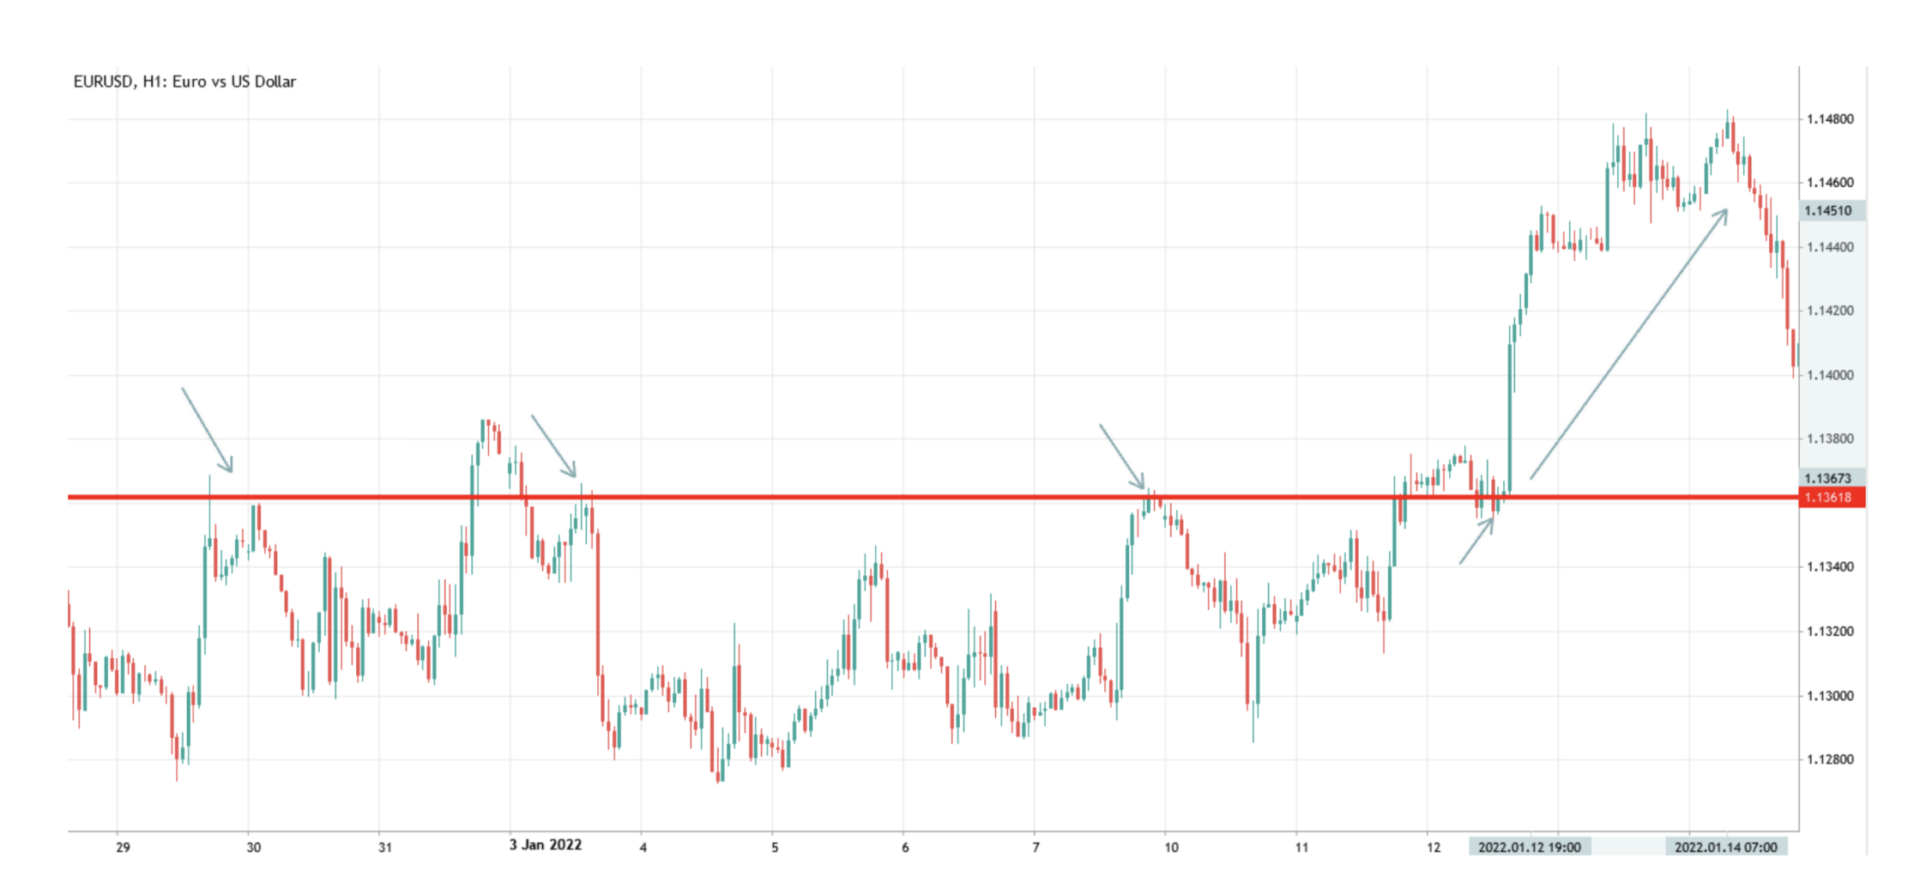
The pair tried to break above its resistance area for almost two weeks, but when it managed to break that resistance, it showed a notable move higher within a few hours right after the break.