Trading patterns
Transitions between rising and sliding trends are frequently indicated by stock chart patterns. Using a sequence of trendlines and/or curves, one can identify a price pattern, which is an identifiable configuration of price movement.
A continuation pattern develops when the trend continues in its current direction after a brief pause; a reversal pattern emerges when a price pattern signifies a shift in the trend direction. There are numerous patterns that traders use; here is how some of the more well-known patterns are created.
Pennant
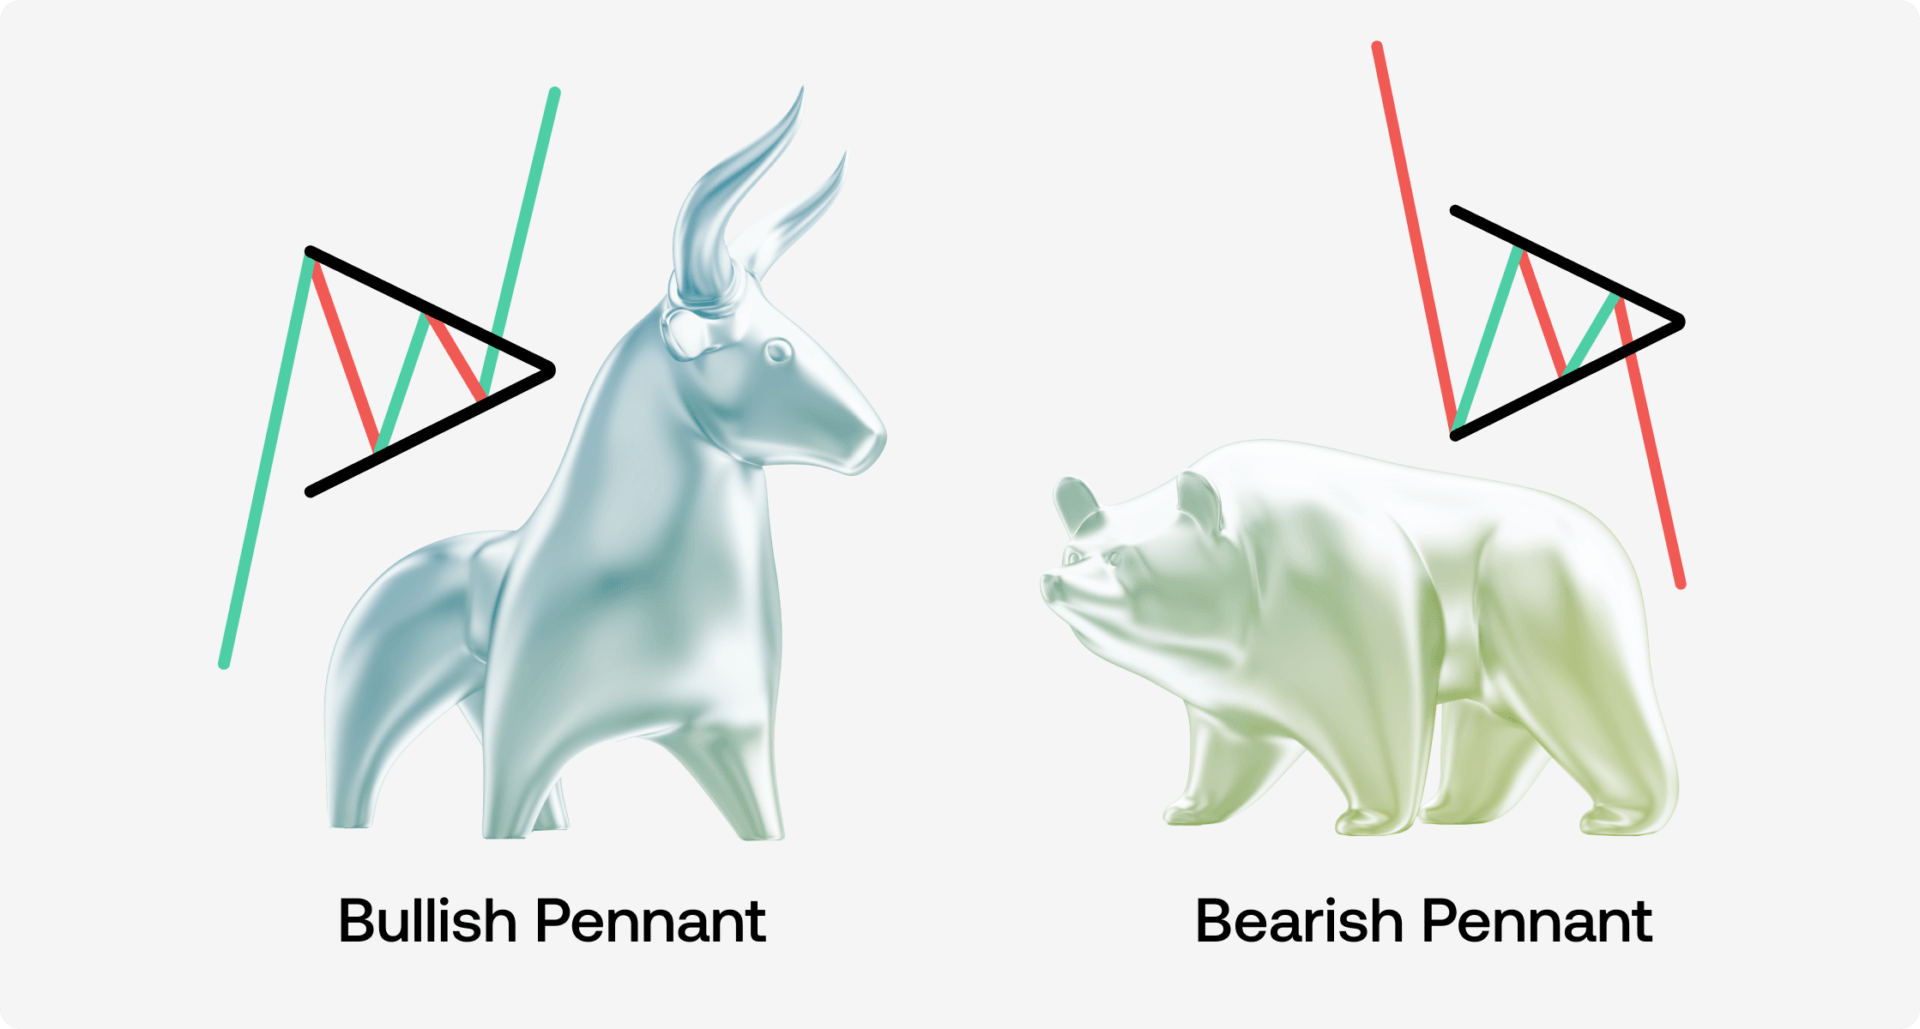
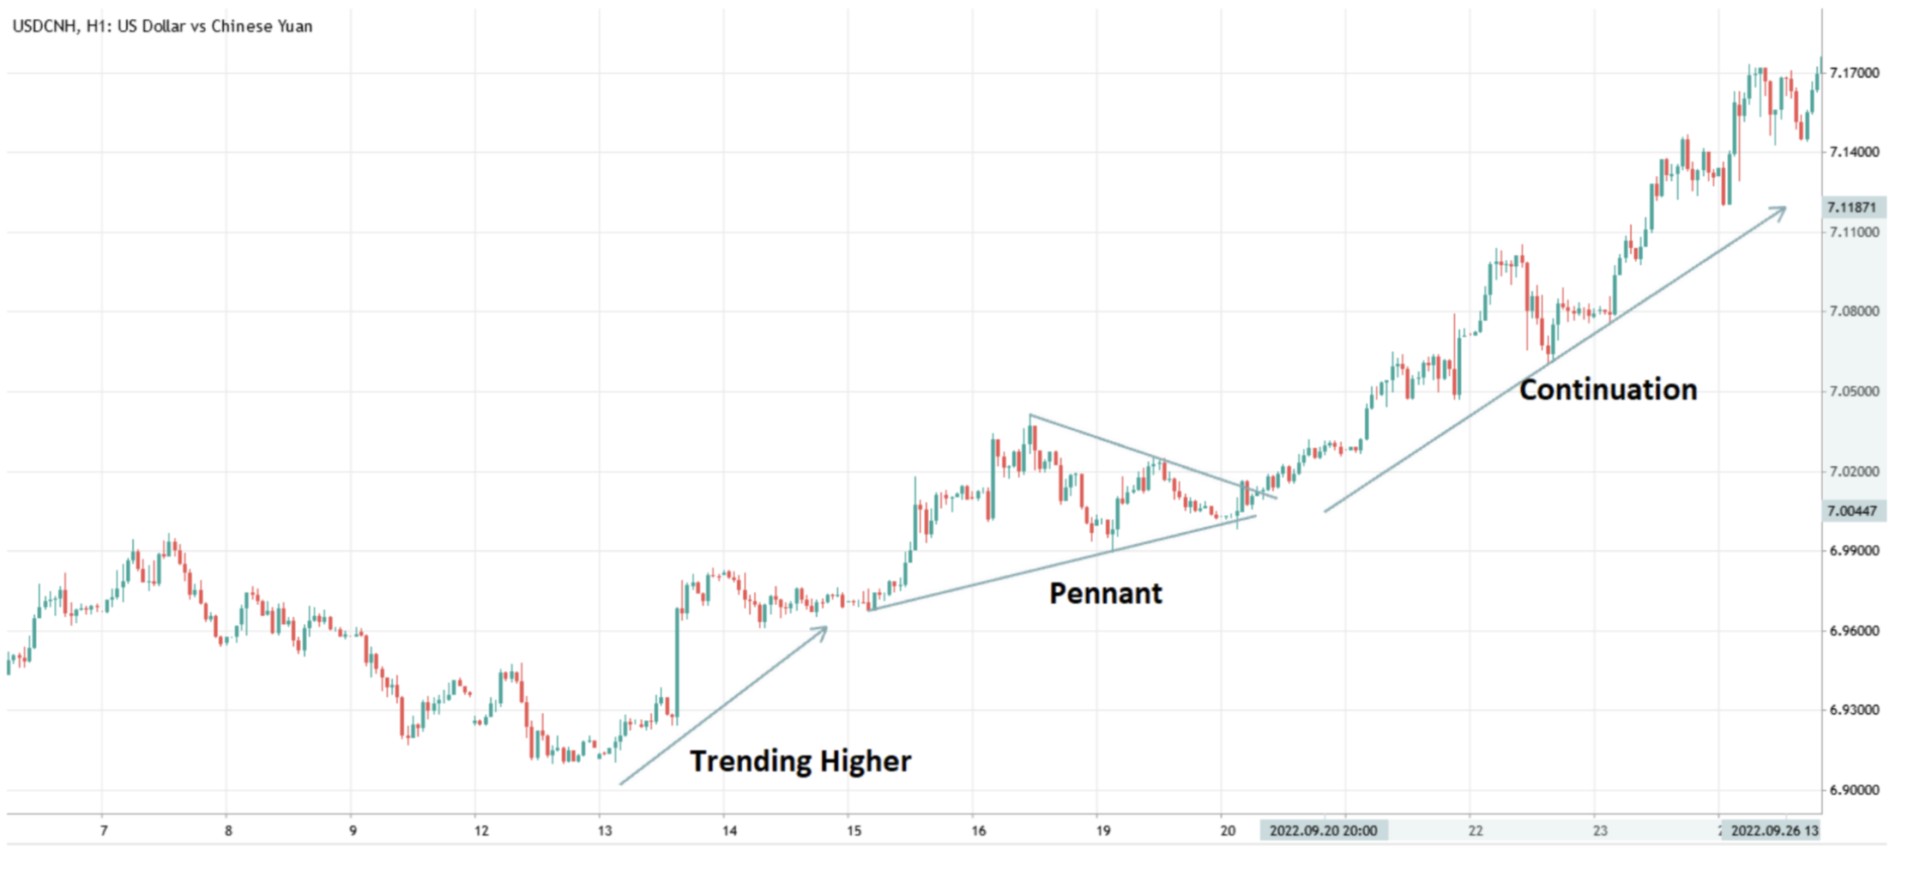
Pennants are continuation patterns created by connecting two trendlines. One distinguishing feature of pennants is that their trendlines travel in opposite directions, one going up and the other down. A pennant is depicted as an example in the illustration below. In many cases, the volume will drop while the pennant forms and then rise when the price finally breaks through.
The flagpole is on the left side of a bullish pennant, which denotes an upward-moving price.
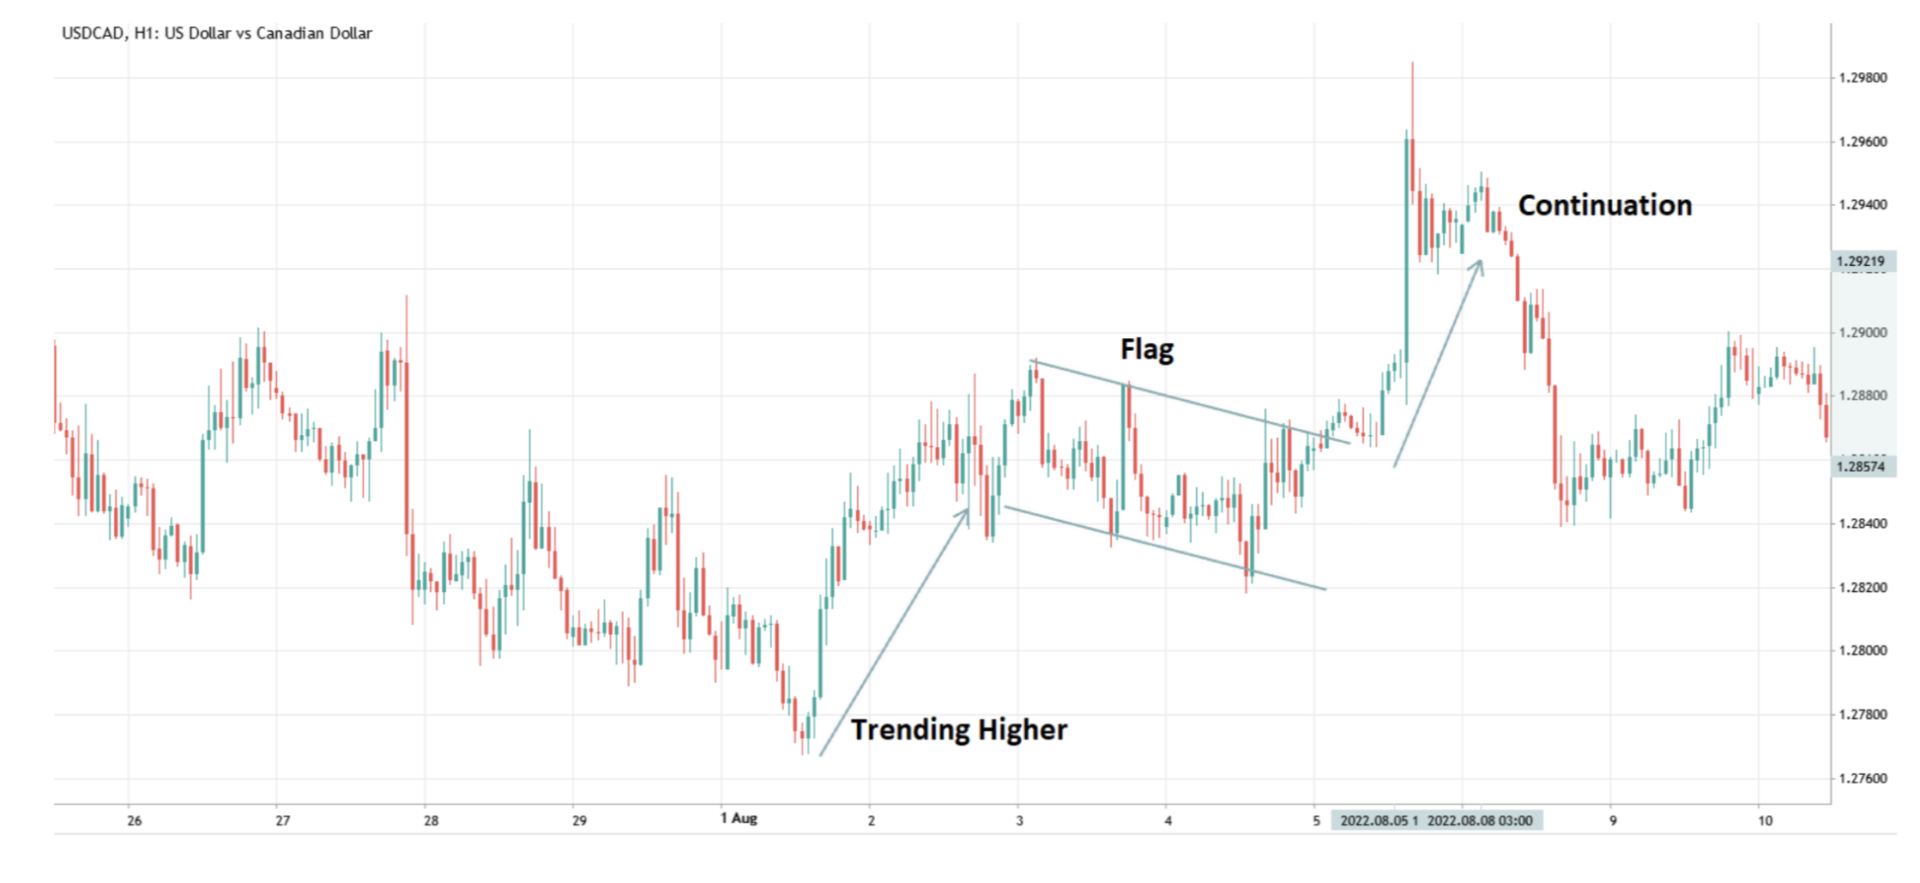
Flag
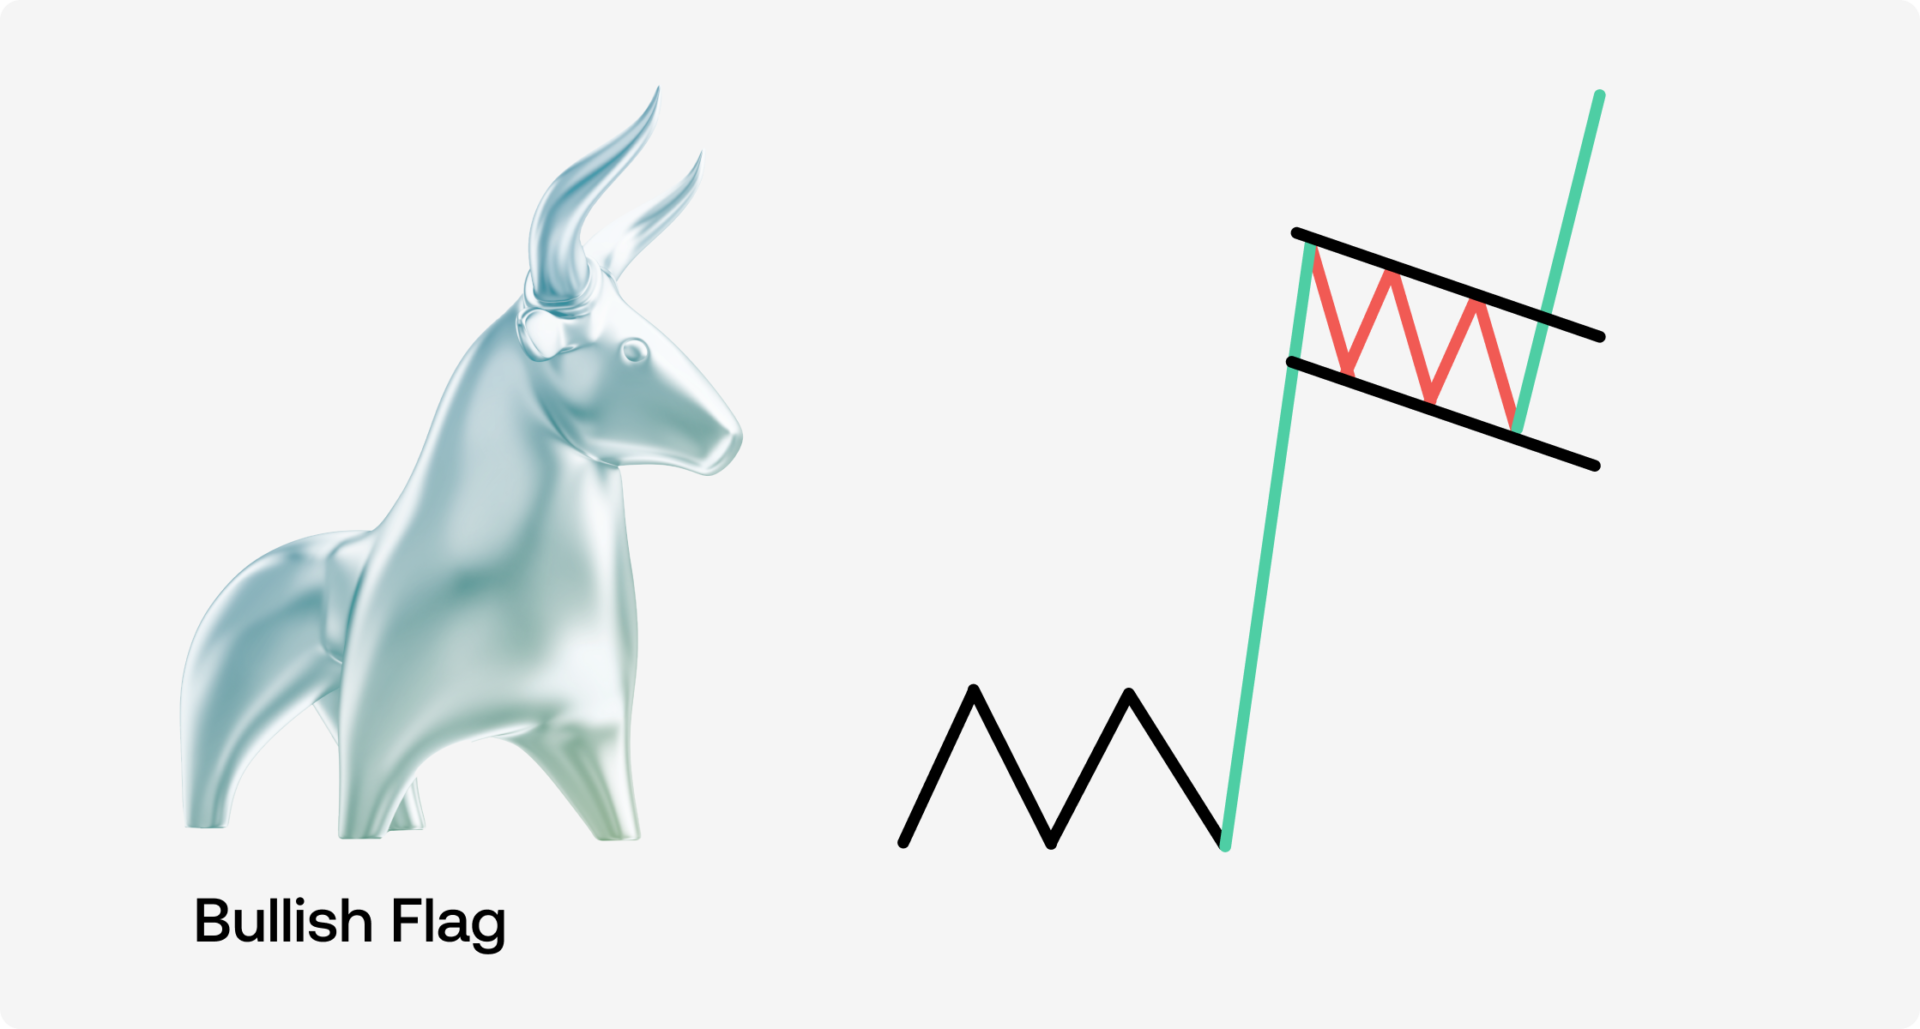
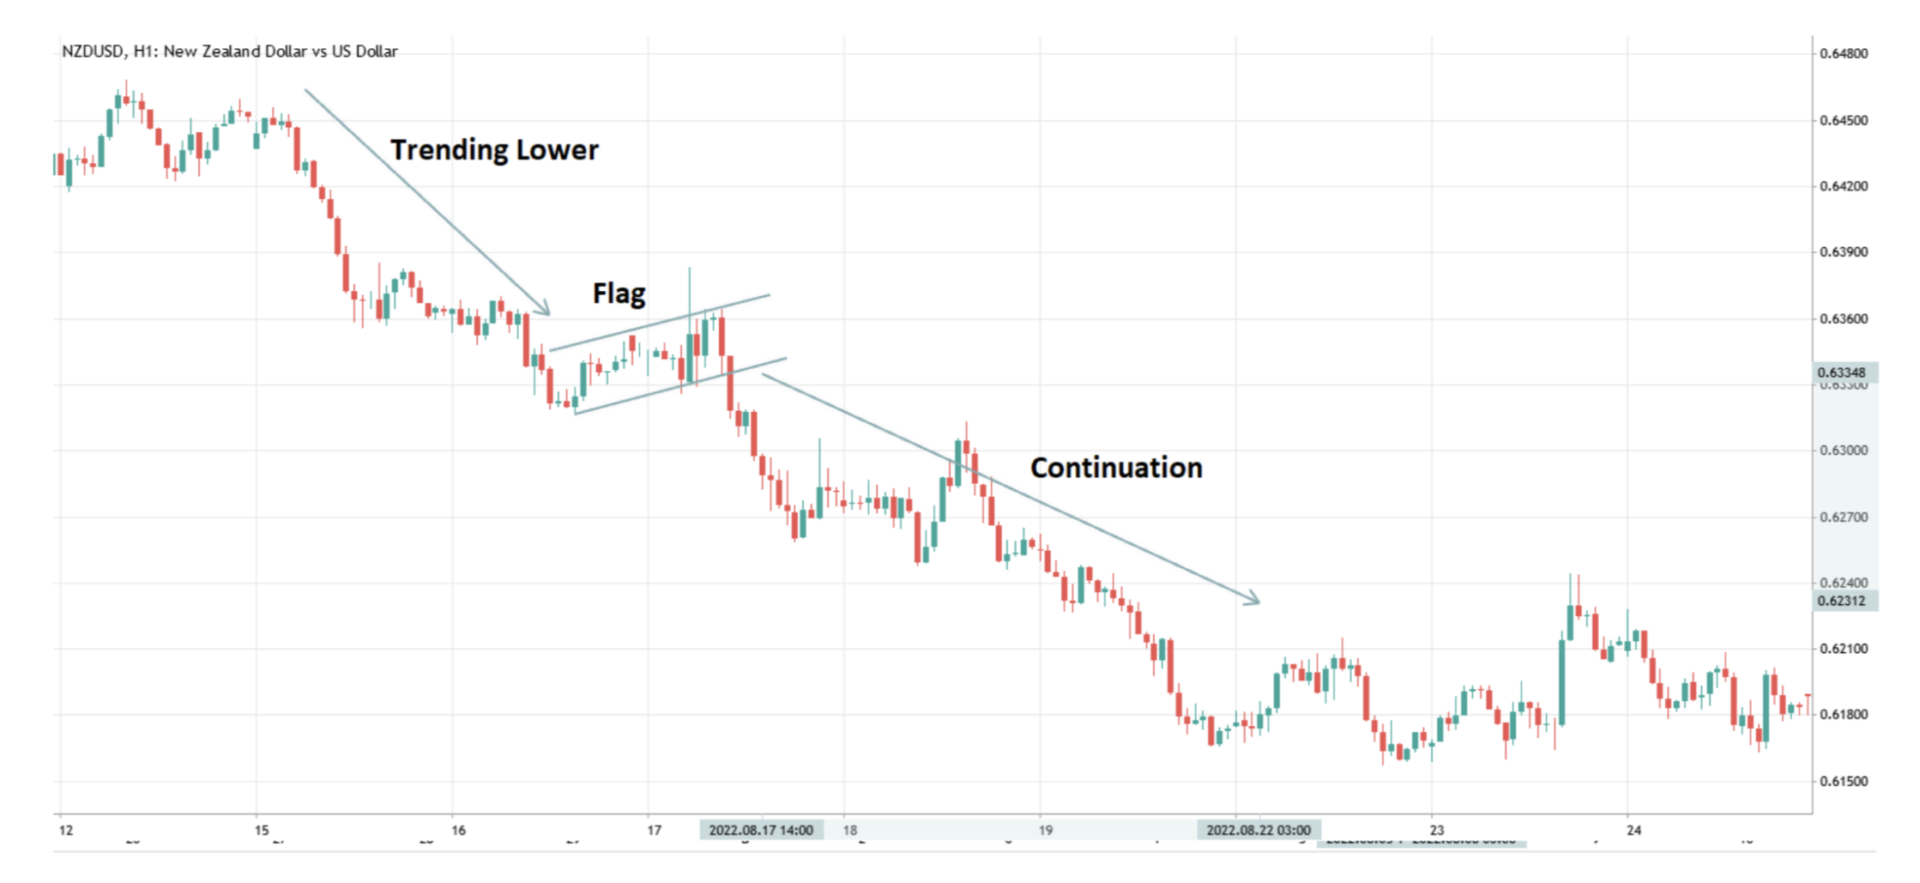
Two parallel trendlines that might slope upward, downward, or laterally are used to produce flags, which are continuation patterns (horizontal). Generally speaking, a flag with an upward slope (bearish) denotes a break during an uptrend, whereas a flag with a downward tilt (bullish) emerges as a halt in a downtrend. Declining volume typically precedes the creation of the flag and increases when the price exits the formation.
Bullish Flag
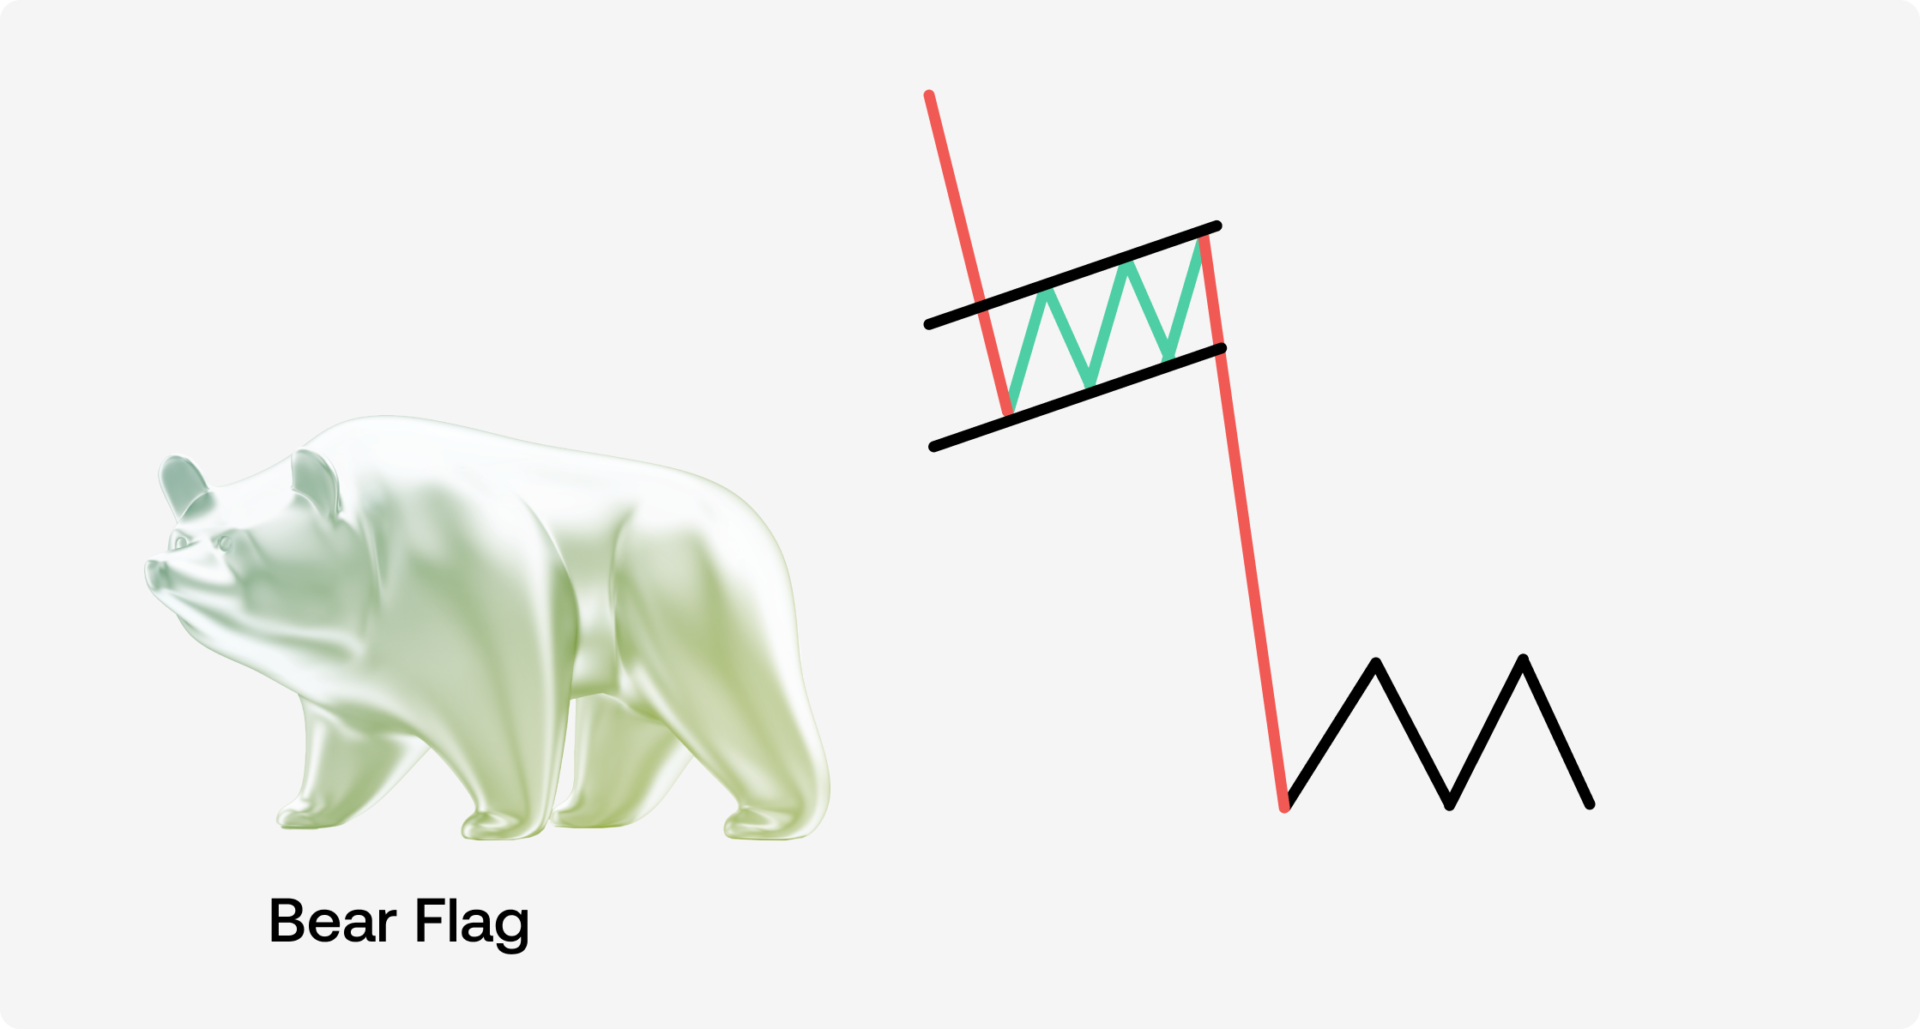
Bear Flag

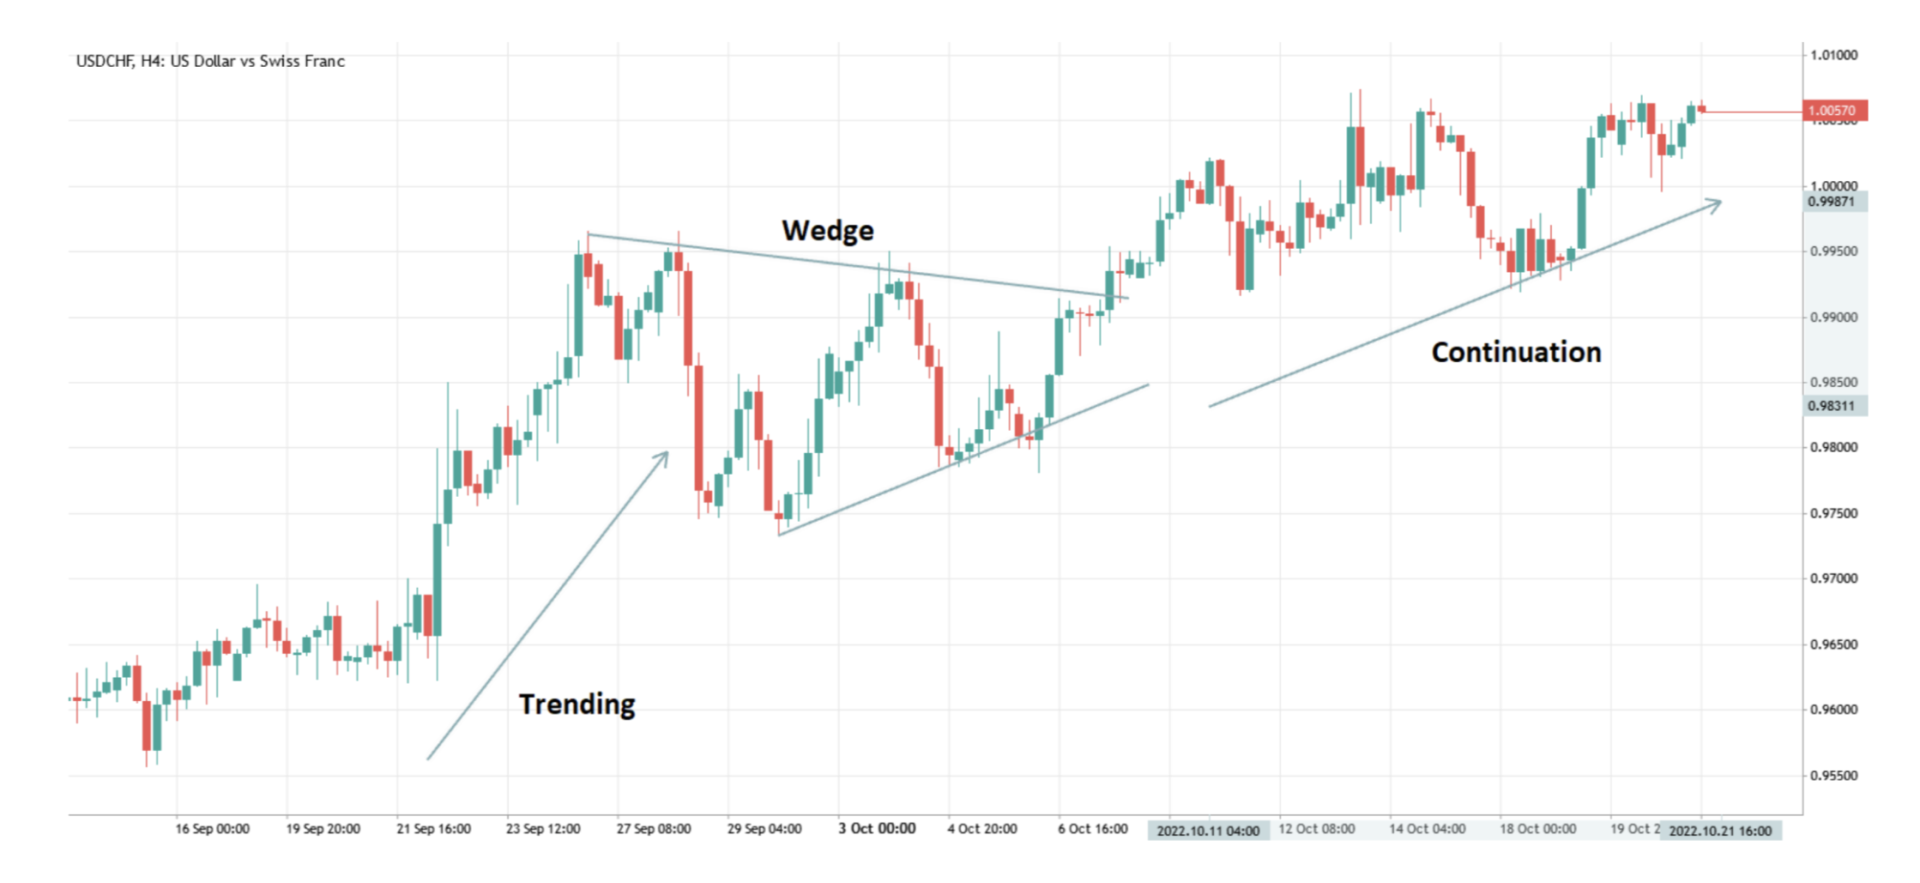
Wedge
Wedges are continuation patterns that are constructed using two convergent trendlines, much like pennants. However, what distinguishes a wedge from a pennant is that both trendlines are travelling in the same direction, either up or down.
An uptrend is represented by a wedge that is inclined down, and a downtrend is represented by a wedge that is angled up. Similar to pennants and flags, volume often decreases while patterns are forming before increasing once the wedge pattern has been broken.
Wedges represent just upward and downward price fluctuations, unlike triangles and pennants, hence they typically have an angled appearance.
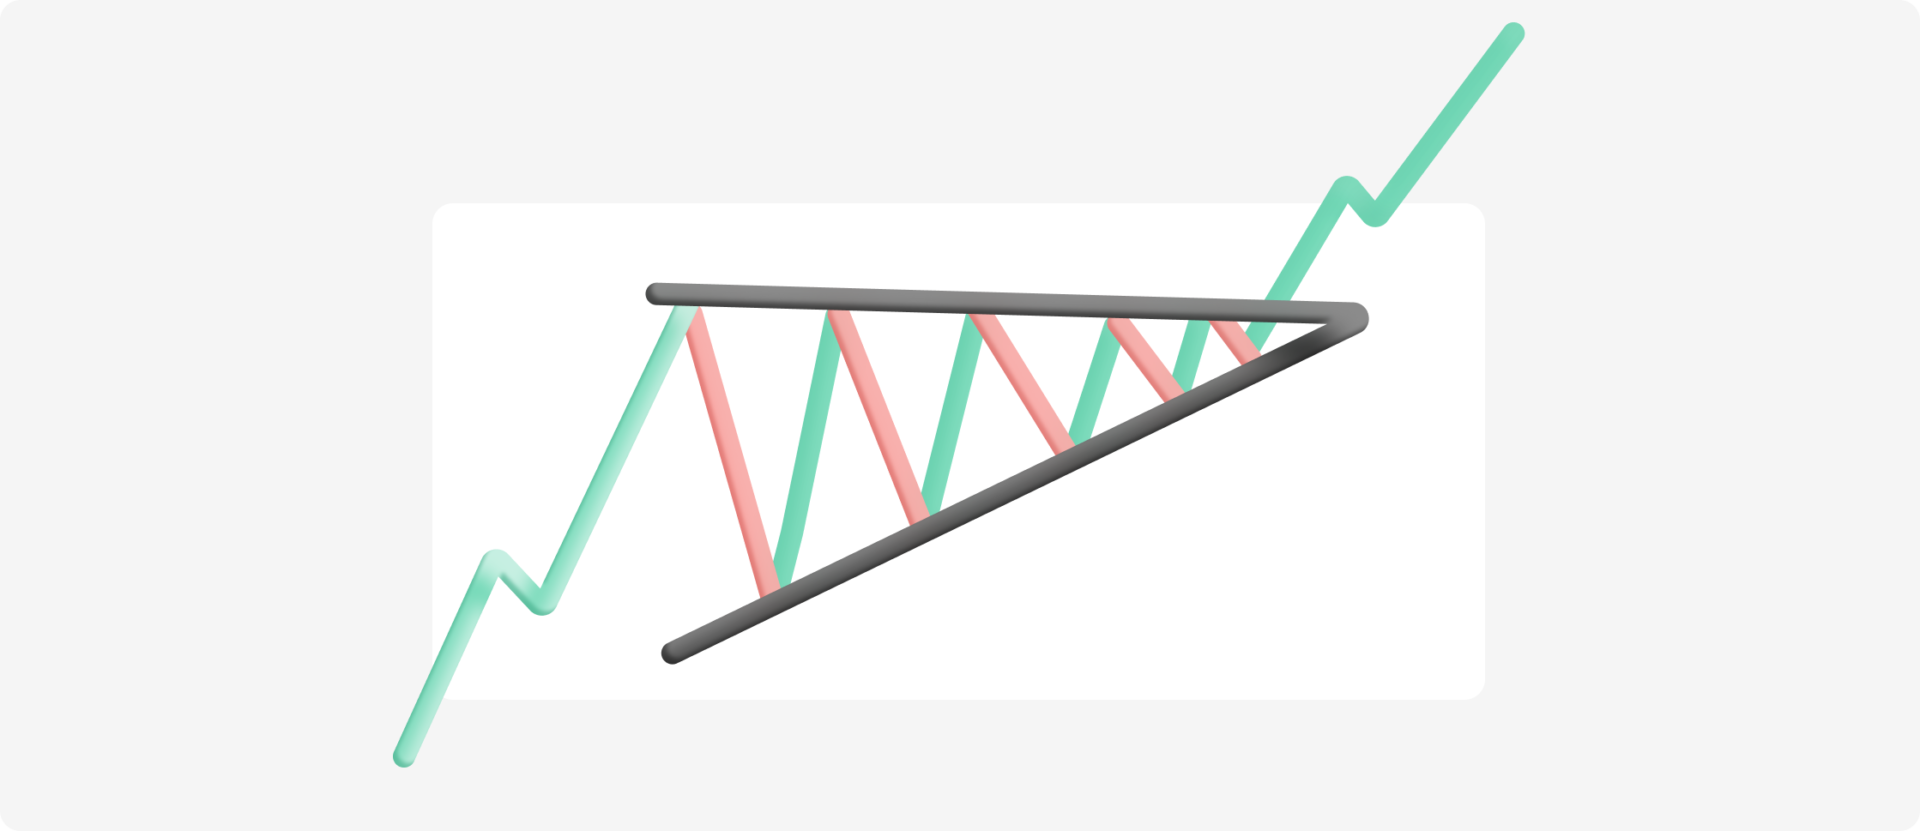
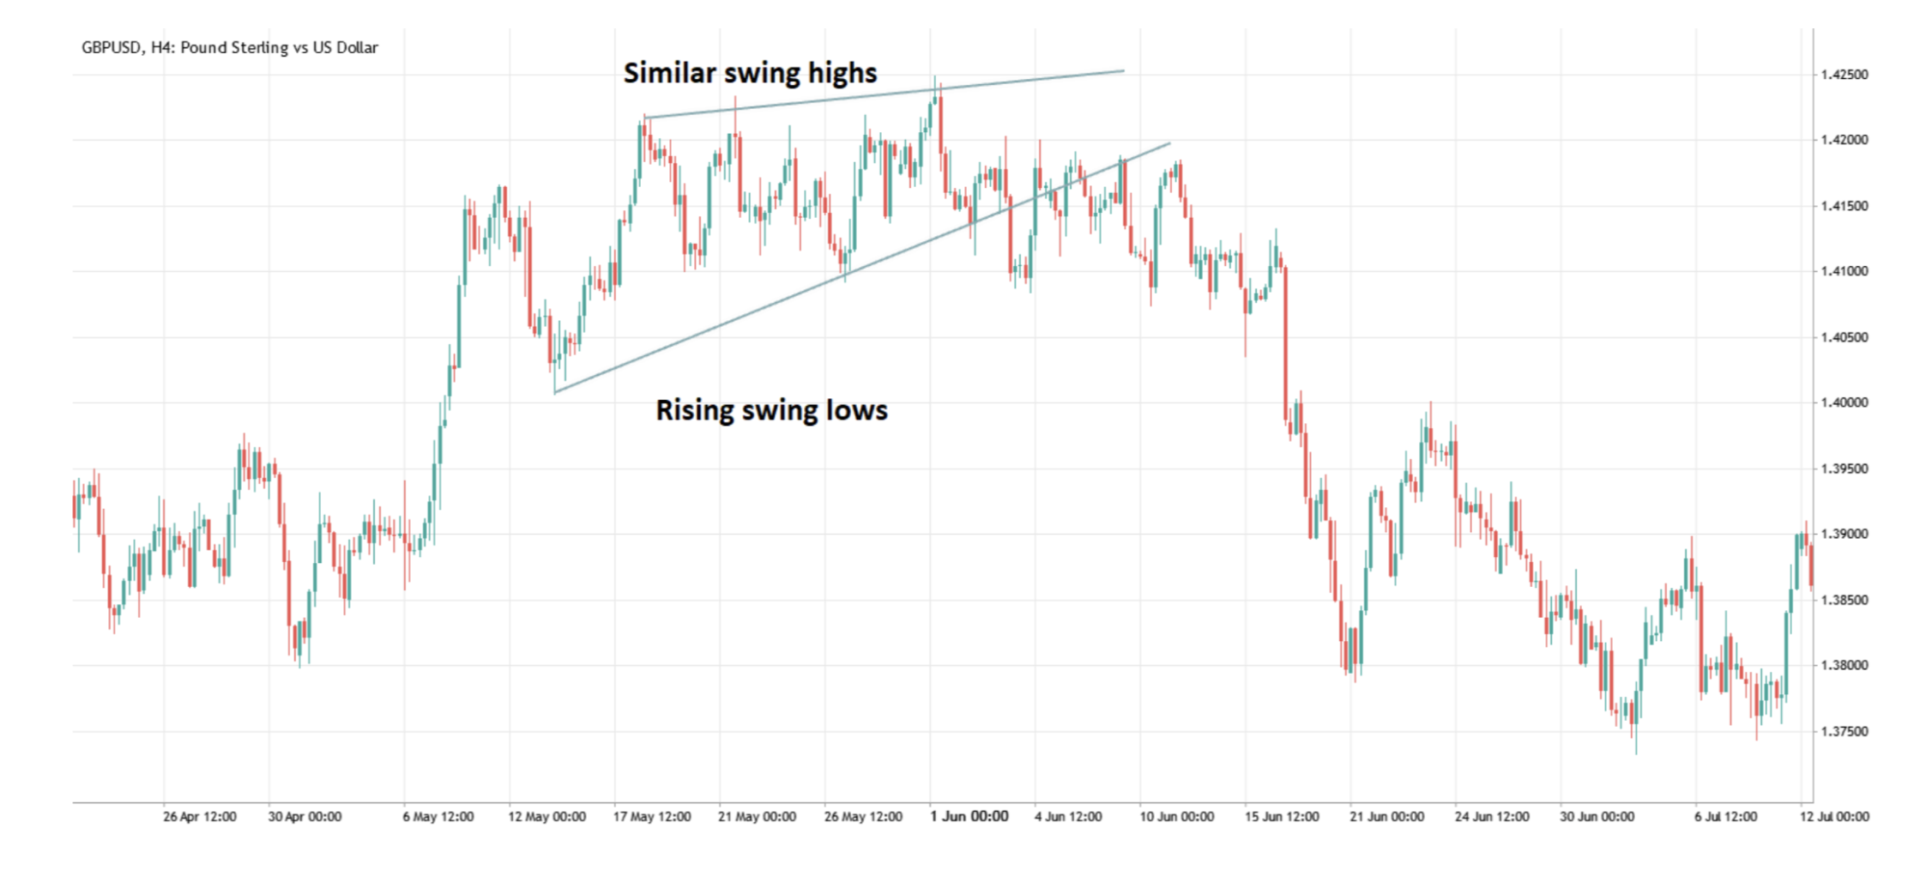
Triangle
Ascending Triangle
A continuation pattern known as an ascending triangle designates a trend with a certain entry point, profit objective, and stop loss level. The entrance point is indicated by the intersection of the breakout line and the resistance line. One bullish trading pattern is the rising triangle.
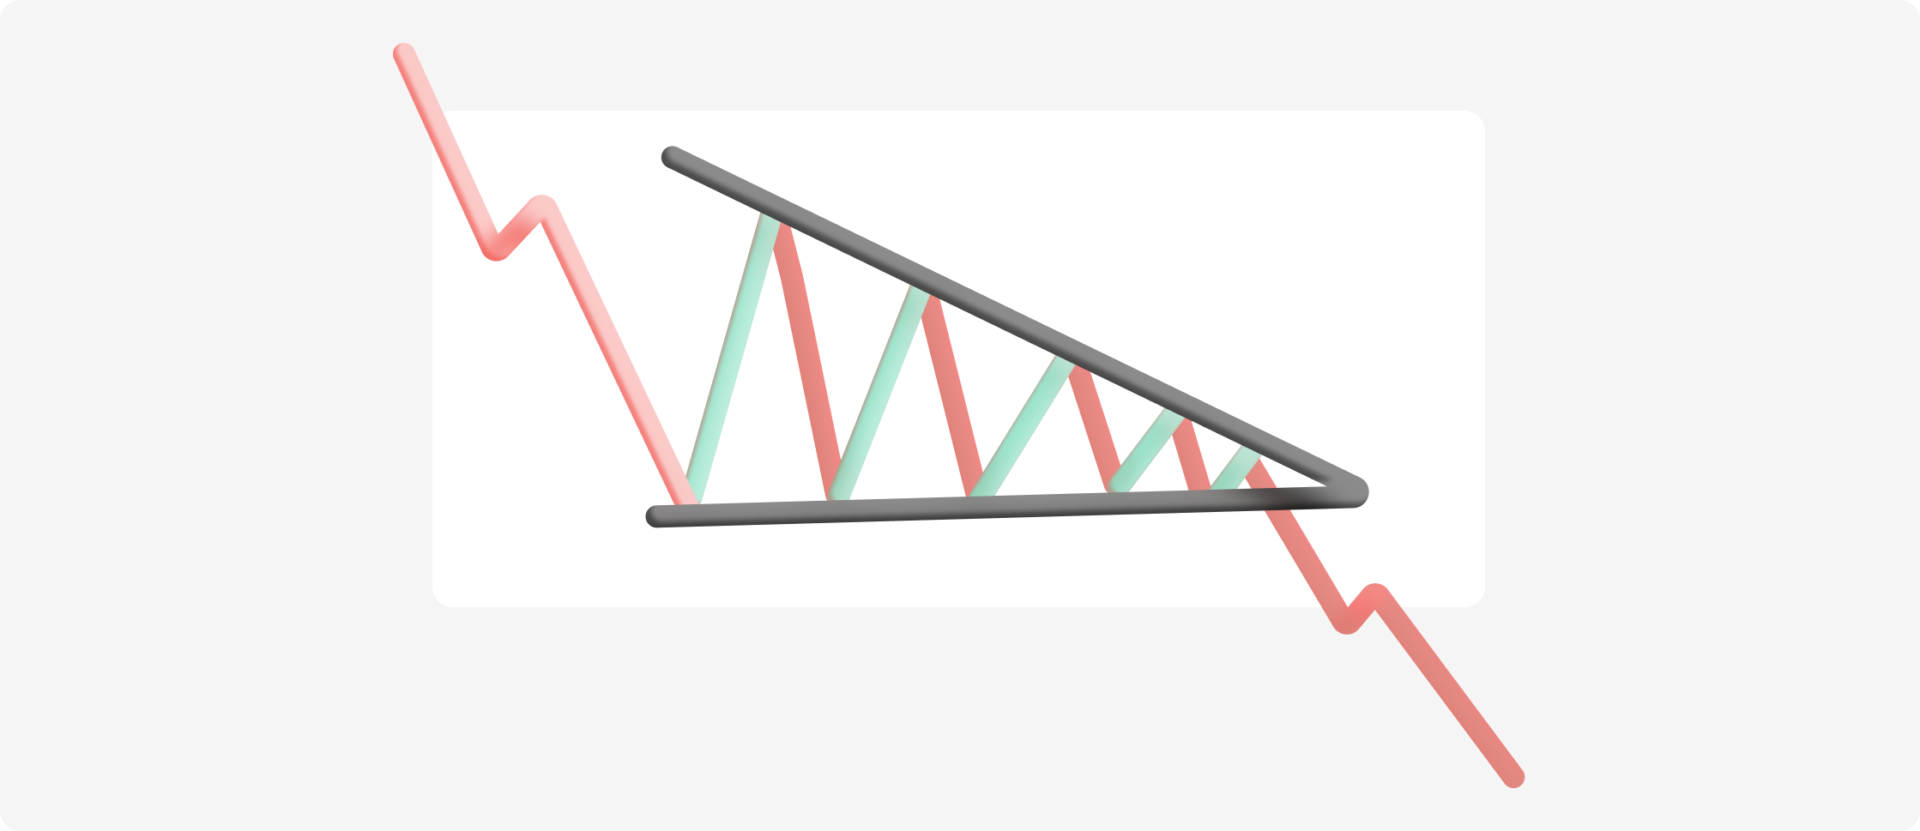
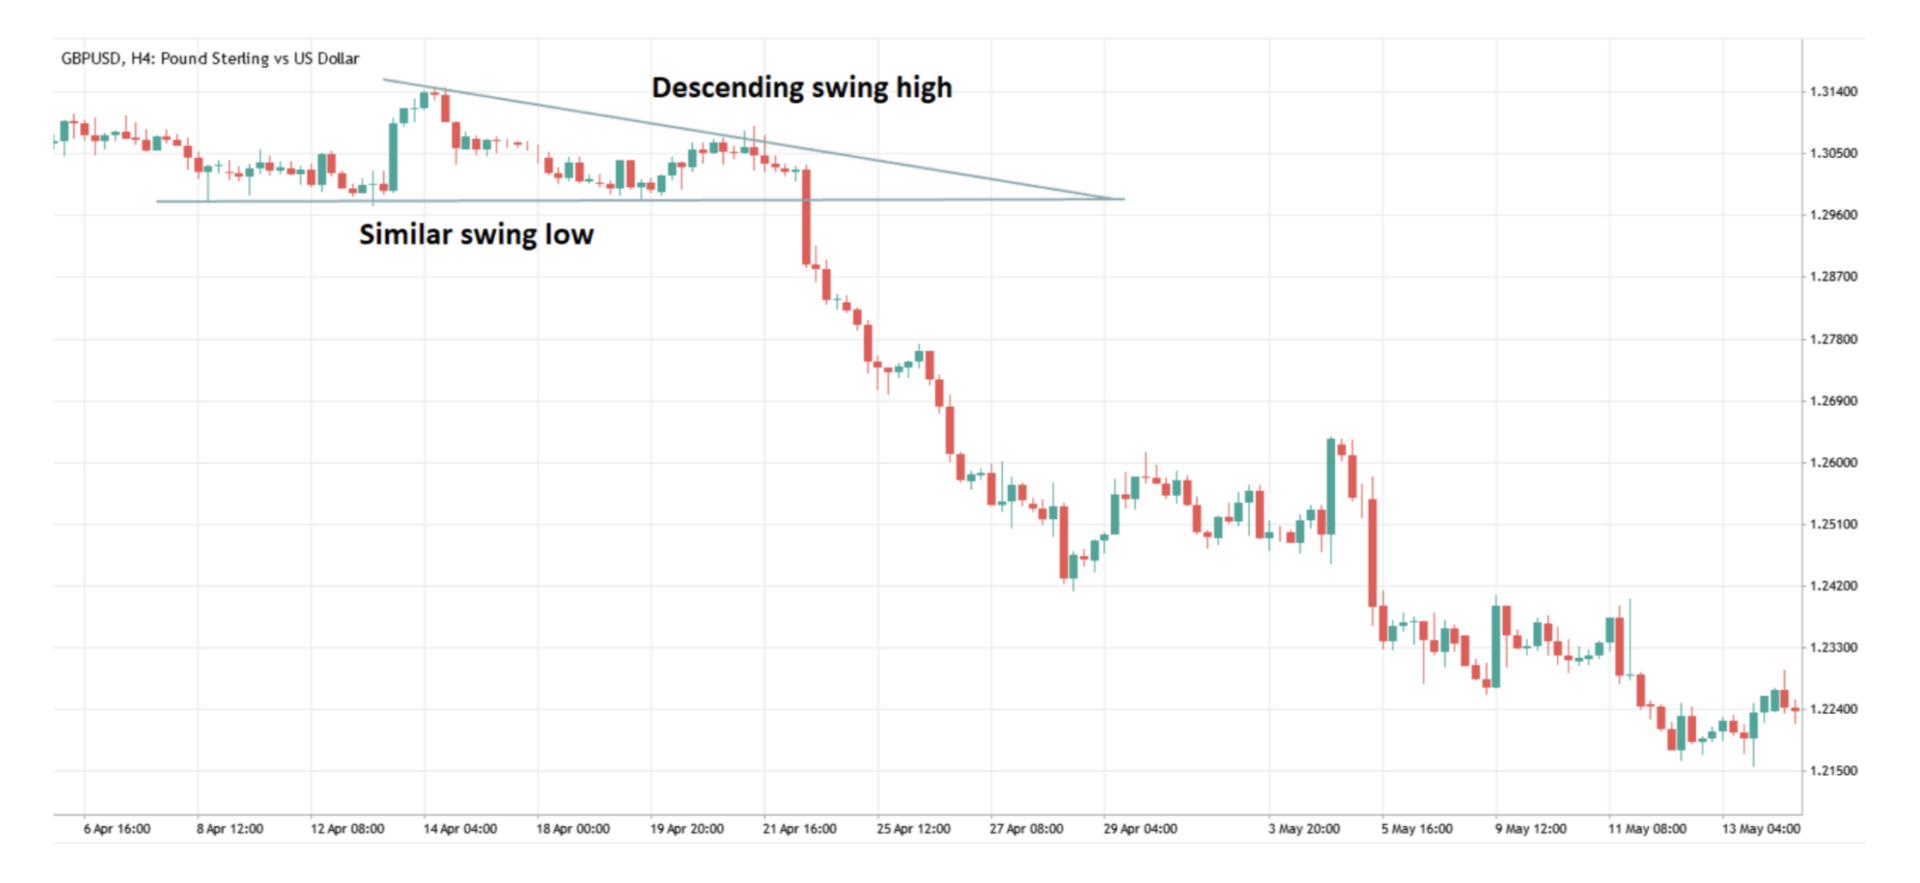
Descending Triangle
In contrast to the ascending triangle, the falling triangle shows declining demand, and a dropping upper trend line signals a breakdown is likely to take place.
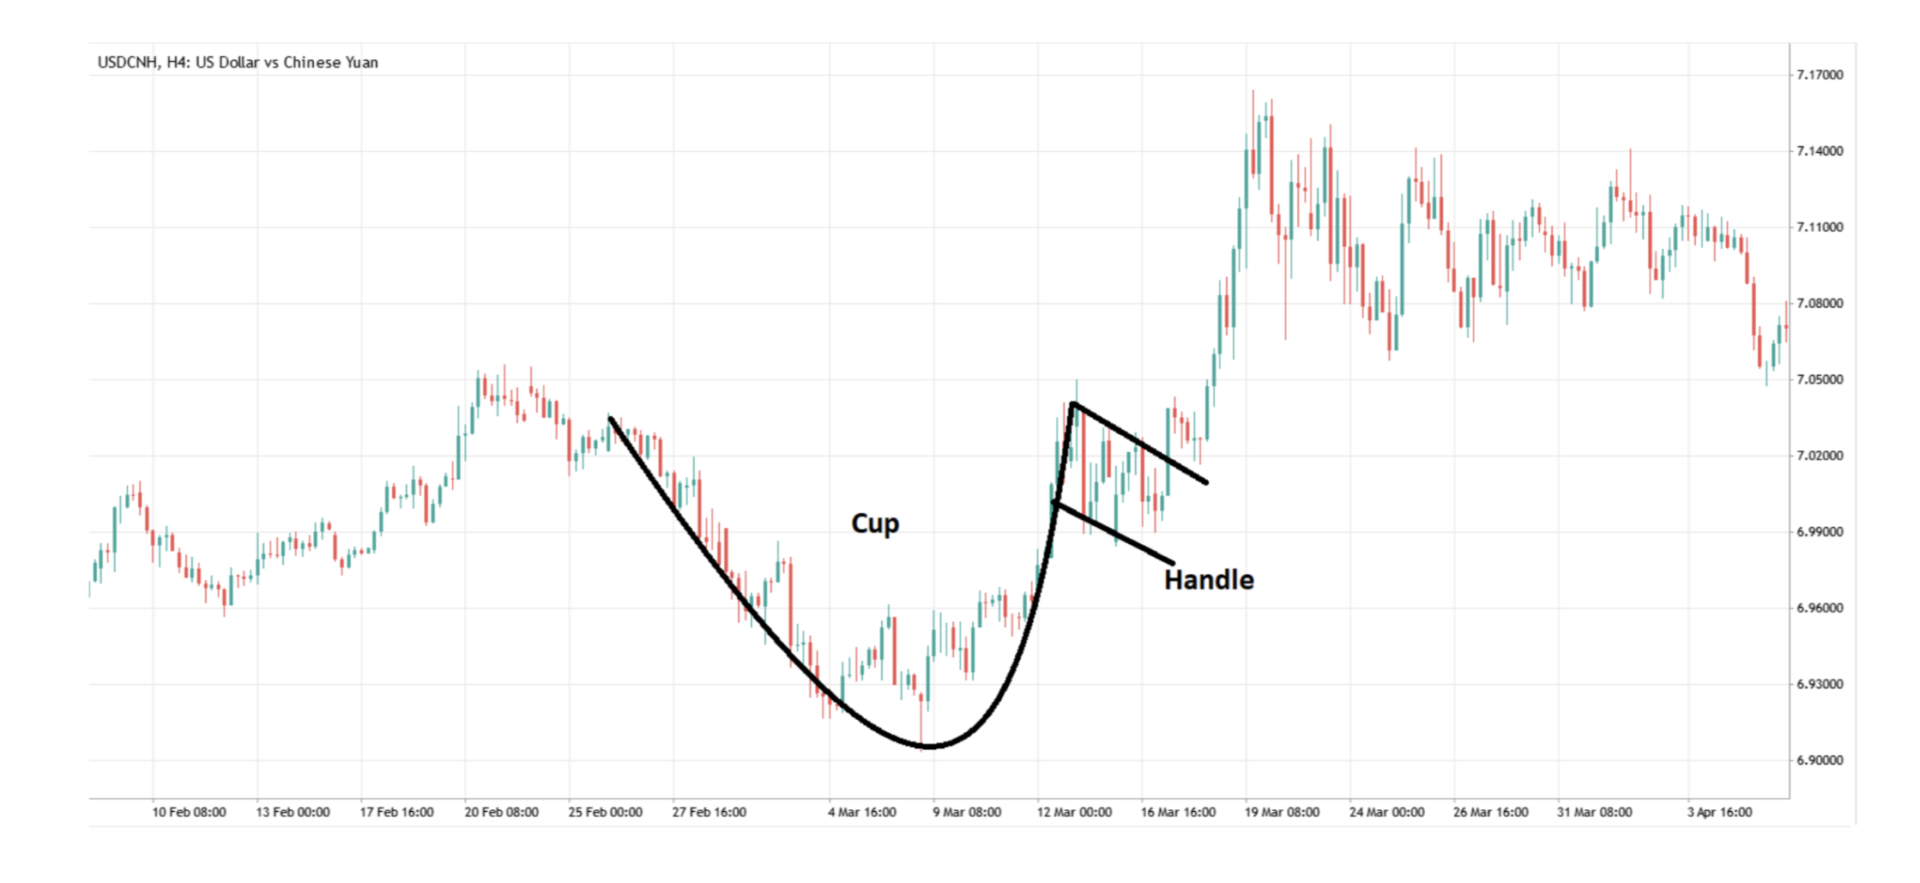
Cup and Handle
A bullish continuation pattern known as the cup and handle indicates that an upward trend has stalled but will resume if the pattern is validated. Instead of a “V” form with equal highs on both sides of the cup, the “cup” section of the design should be a “U” shape that resembles the rounding of a bowl.
On the right side of the cup, a brief pullback that resembles a flag or pennant chart pattern defines the “handle.” The stock may breakout to new highs and resume its upward trend once the handle is finished.