From Chart Patterns to Wyckoff Theory. Part 1: Accumulation


Technical analysis offers countless indicators and strategies, but most only highlight entry and exit points without revealing the market’s full picture. When a strategy fails, traders often struggle to understand why. Yet one man, through relentless study and practice, developed a logical, effective theory that earned him tens of millions.
Richard Wyckoff remains a pioneer who uncovered market truths that others overlooked. His method was so precise that it was once out of reach for retail traders.
This article unveils his secrets and tactics, helping you grasp the true forces driving the market.
Accumulation, mark-up, distribution, mark-down
Wyckoff discovered that markets always move in the same way, following 3 distinct phases:
- Mark-up. Known today as a “bullish trend”, it happens when demand is higher than supply (more people buy, fewer people sell) and market participants push prices higher.
- Mark-down. The well-known “bearish trend”. It appears on the chart when supply is greater than demand (more people sell, fewer people buy), and prices fall lower.
- Consolidation. It is a range phase, where supply and demand match each other’s strength and prices remain relatively stable between the same price highs and lows. Depending on the outcome of the consolidation, Wyckoff's theory distinguishes accumulation from distribution.
When prices leave the consolidation to the upside, it’s an accumulation. When they break to the downside, it is a distribution. Consolidation can happen not only in a perfectly flat channel but also inside upward or downward-inclined ranges.
According to R. Wyckoff, the best entry point for your trade lies inside the consolidation phase because it gives you a higher risk/reward potential.
Wyckoff studied consolidations and made a legendary breakthrough. The way these price structures developed was always the same. After some time, he developed simplified schematics for each variation: both the accumulation and distribution.
Accumulation schematic
A consolidation becomes an accumulation when prices leave it to the upside. It is called that way because important market participants “accumulate” their positions before allowing the price to go higher. Before that moment, you can never know for sure that it is going to behave exactly that way. However, you can forecast it from how the structure develops.
Below, we are going to analyze an accumulation schematic after a downtrend.
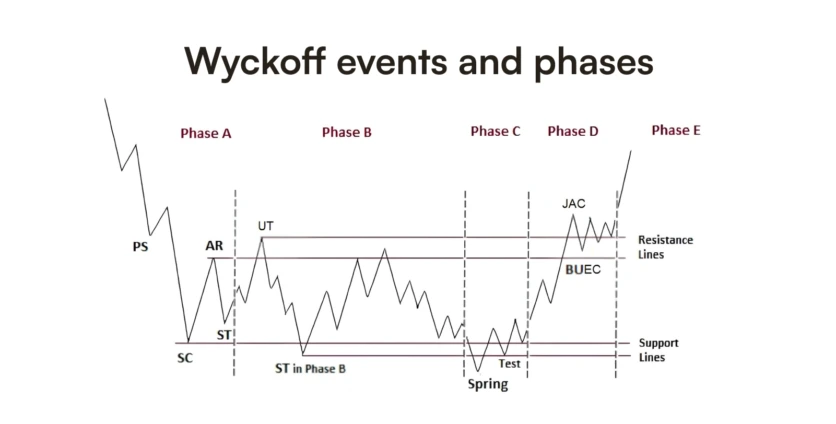
Phase A – the trend stops
The trend phase (be it mark-up or mark-down) ends when you notice a spike in volume, which is bigger than any volume amount recorded before or during that trend. It can happen either during a Preliminary Stop (PS) or during the Selling Climax (SC).
After that, the trend reverses to the opposite direction, causing a Change of Character (ChoCH). This is the Automatic Reaction (AR). The phase ends when the price returns to the SC and bounces off, failing to make a lower low. This is the Secondary Test (ST).
Phase B – manipulation
The range develops but does not follow classical technical analysis. The same highs are broken first to the upside, followed by a quick reversal back into the range. This is an UpThrust (UT), which fuels the movement back into the range by taking out the Stop-Losses of those who thought this was a breakout.
A Stop-Loss (SL) is a sell order. By triggering it, an asset experiences heightened selling pressure, proceeding lower. Then, a second manipulation happens at the lower edge: This is the ST in Phase B. The logic is identical to that of the UT – by taking out the SLs of those who shorted, the price quickly gets back into the range.
Manipulations often happen on higher volumes. If the volume is low, chances are that this is a fake manipulation, and the price is about to proceed in the direction of the past trend.
Phase C – manipulation of the manipulation
After spending some time ranging back and forth inside the consolidation, the price attempts a stronger breakout to the downside. Many fall for it again, entering shorts. This is the Spring, which first wipes out the SL of those who entered long on the ST in Phase B and then takes out the SL of the breakout shorts. After carrying out a Test on the lower edge, the price proceeds to the upside.
Phase D - a sign of strength
After the Spring, the price breaks over the edge, created by the UT in Phase B. However, the price fails to fall back quickly into the range, proceeding to do a local, smaller consolidation instead. This is a Jump Across the Creek (JAC). At some point, the price returns inside the range to test if there is buying pressure.
This is the Back Under the Edge of the Creek (BUEC) phase, the one in which Richard Wyckoff preferred to place his trades.
Phase E – the trend resumes
As soon as the price returns to the JAC on strong volume, open a long trade. Place the SL under the BUEC and take advantage of the full momentum of the following Mark-up.
Practical accumulation example
Accumulations happen on every timeframe, on every asset or currency. Take Bitcoin in 2024, for example. This accumulation happened after a bullish trend, but the structure’s principles are the same.

It was one of the most technically pure accumulations in modern times. After a PS at the beginning of March, BTCUSD proceeded higher for some time but ultimately marked a Buying Climax (BC). After that, just like in theory - AR, ST.
In Phase B, the cryptocurrency made a little manipulation on the downside (ST in Phase B) first, and then proceeded to do the UT. It happened in this order, and not like in the schematic above because we enter an accumulation after a Mark-up, not a Mark-down.
After Phase B comes a Spring on the highest volume so far. Then, price experiences a strong pullback to the center of the range before finally doing a Test of the lower edge.
Then, a bullish run, stopped in the JAC and BUEC phases. Here, you could have gone long. Exactly after Price retested the upper edge, President Donald Trump was elected. BTCUSD skyrocketed into the stratosphere.
Conclusion
The Accumulation phase is not the only tradeable structure in Wyckoff's Theory. We will also cover distributions and trend strategies.
Remember that the most rewarding way to trade an Accumulation is to trade the Spring and BUEC phases.
Discover the latest Headway updates on Telegram, Facebook, and Instagram.


