From Chart Patterns to Wyckoff Theory. Part 2: Distribution


In the previous article of this series, we learned what breakthrough Wyckoff’s theory offers you in terms of trading edge. We have already explored the significance of accumulation structures, now it is time for distribution. If you have not read it yet, we suggest you first read the first article and learn how to trade accumulations.
A distribution phase is a consolidation range in which the price leaves the downside at the end of its development. It is called so because important market participants (the Smart Money) sell their stocks of an asset before allowing the price to dip against them. They do that to fix their profits from long positions or accumulate short positions.
Distribution schematic
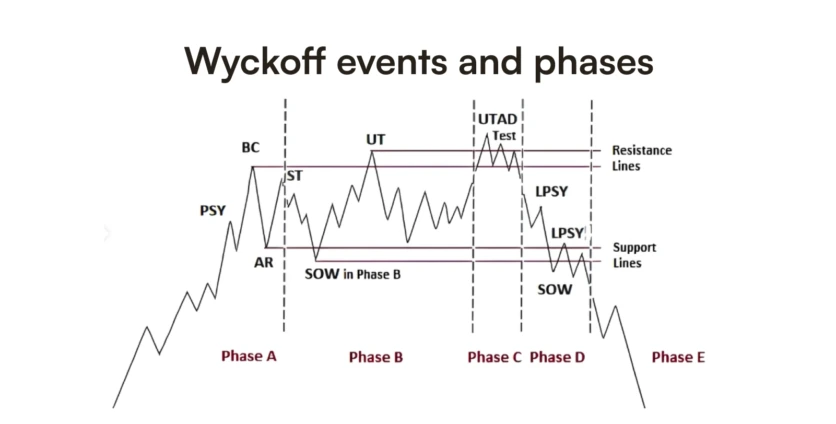
Phase A – the trend stops
A distribution phase is the specular version of an accumulation. It begins with a spike in volume at the end of a mark-up or mark-down (uptrend and downtrend). The spike can happen both at the Preliminary Supply (PSY) or at the Buying Climax (BC). As for accumulations, the next steps are the Automatic Reaction (AR) and the Secondary Test (ST)
Phase B – manipulation
As for accumulation, in this phase, the price takes out first the AR-low, which is a Sign of Weakness (SOW Phase B), and then the ST-high with an Upthrust (UT). After that, the price must return to the lower edge of the range.
Phase C – upthrust after distribution (UTAD)
This phase is a lot like the Spring phase for accumulations. Price breaks out of the range and forms a local, smaller consolidation. However, it fails to go higher and deliver another higher high. Instead, the price returns into the range, after a Test of the previous higher edge.
Phase D – last point of supply (LPSY)
After the UTAD, the price falls to the lower edge, breaking through the SOW in Phase B edge. After a quick retest, the price proceeds with another lower low.
Phase E – the trend resumes
After closing below the last low, the price resumes the trend phase in a markdown.
The best point to enter trades from a risk/reward standpoint is found after the UTAD or after the LPSY.
Practical distribution example
Let’s look at a practical application of the distribution schematic.

In the image above, you can see the Australian dollar against the US dollar on a daily chart. After a bullish rally, the trend showed signs of slowing, first at the PSY, then by a spike in volume – the BC.
Interestingly enough, on this occasion, after the AR, the ST happened far higher than the supposed upper edge. It is a reminder that the theoretical schematic is not always followed to the letter, and sometimes some elements change their behavior. That’s why you should not trade until the price shows clear signs of strength or weakness.
Then, like in the schematic, SOW in Phase B and a UT happened. Soon after the UT comes the UTAD. At this point, we can also spot a difference between the books and reality. While the UTAD took out the previous UT highs, the local consolidation happened below the upper edge, not above.
You should always consider the context. If the price draws a phase lower than it is supposed to, it is an additional sign of weakness. If the price draws a phase higher than it should, it is a Sign of Strength (also marked on charts as SOS).
In any case, in Phase D everything happened just like in a regular schematic – SOW, a retest (the LPSY), and then the pivot of the trend.
Conclusion
Distributions are a powerful tool to gauge the market’s most probable direction. Together with accumulation phases, it constitutes the backbone of the Wyckoff Theory.
It is a method proven and tested by time, offering a high risk/reward ratio for your trades. Remember, that reality often does not behave entirely like schematics. Schematics are drawings conceptualized to understand better the underlying logic of the market.
In any case, if you know how to trade Springs, Upthrusts, BUECs, and LPSYs, you can quickly become a very profitable trader, using any time frame you like.
Discover the latest Headway updates on Telegram, Facebook, and Instagram.


