How to Place Your Stop-Loss: An Expert Guide to Risk Management


Effective risk management is the backbone of profitable trading, and correctly placing a Stop-Loss (SL) is one of the most critical skills a trader must master. This guide will focus on practical methods, indicators, and volatility-based approaches to placing Stop-Loss orders effectively.
Understanding SL placement
A Stop-Loss is an automatic order to exit a trade when the price reaches a predetermined level, preventing excessive losses. However, placing an SL too close can result in premature stop-outs, while placing it too far can lead to unnecessary losses. The key is to strike a balance between risk protection and trade viability.
There are various methods a trader can use to place the SL perfectly. The main risk-management strategies can be subdivided into:
1. Price action-based Stop-Loss
This method follows the rules of price structure, does not require additional indicators, and can be analyzed by looking at a bare candlestick chart.
To understand this method, a trader must first be acquainted with the Smart-Money trading method’s notions of BOS and CHoCH. The Break of Structure (BOS) occurs when the price forms a higher high in an uptrend or a lower low in a downtrend. The Change of Character (CHoCH) occurs when the price forms a lower low in an uptrend or a higher high in a downtrend.
To place the Stop-Loss using this method, you must wait for a valid BOS to happen. To be valid, the candlestick breaking the structure must close over the structure line (BOS-line) in uptrends and below the BOS-line in downtrends.
After a BOS is valid, you can place the SL below the last low of the price structure in uptrends (over the last high in downtrends). Here is an example of this method on a CADJPY 1H chart.
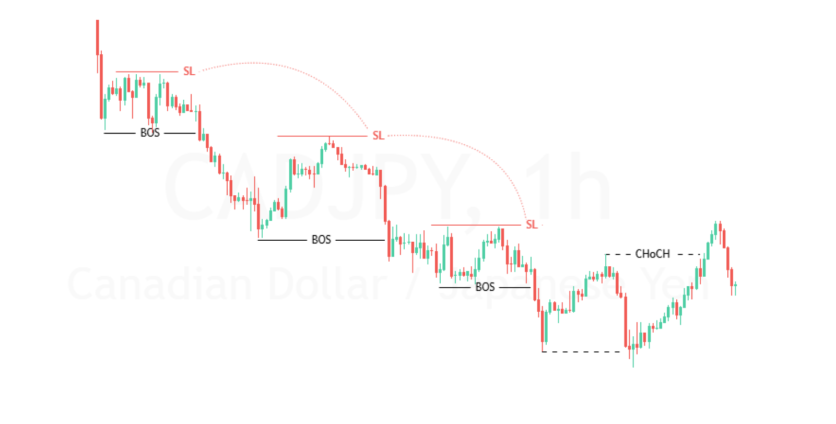
As long as the currency pair keeps breaking the structure, the SL can be moved. At the end of the trend, we see that the price failed to close below the BOS line and pulled back up. Soon after, a CHoCH appeared, ending the trend.
Placing stops below key lows (for long trades) or above key highs (for short trades) is a logical strategy. Consider using wicks as reference points rather than closing prices.
2. Indicators based Stop-Loss
Many indicators can be used to determine the levels at which to place the Stop-Loss. Two of them are the most precise when it comes to risk management – Moving Averages and the Parabolic SAR.
Moving averages can act as dynamic support and resistance levels. You can use the 50-MA or 200-MA as a Trailing-Stop on any timeframe of your choosing. The SL must be placed just below the moving average for long trades and above it for short trades.
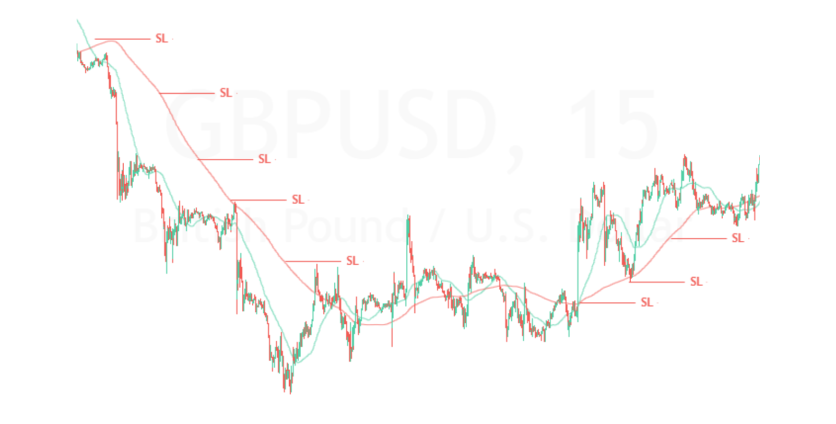
In the following GBPUSD 15M chart example, you can see that if you used the 200-MA as a dynamic resistance first and as a dynamic support after, you would have profited from strong bearish and bullish momentum.
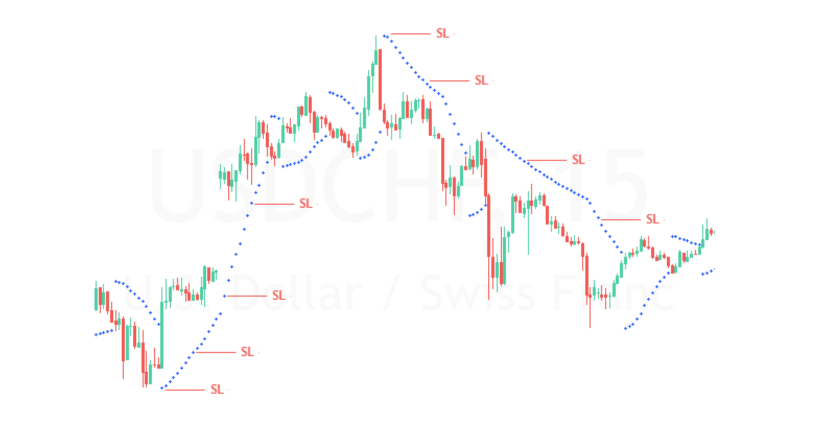
The dots of the Parabolic SAR indicate potential reversal points. Place stops below SAR dots for long trades and above them for short trades. Adjust stops dynamically as SAR values update.
This second indicator gives more precise information, so more often than not, it can be useful to capitalize on prolonged trends, rather than short-term trending fluctuations.
3. Volatility-based Stop-Loss
Markets are not static, and a good Stop-Loss should adjust to volatility changes. For this method, you can also use one of the following indicators: Bollinger Bands or the Average True Range (ATR).
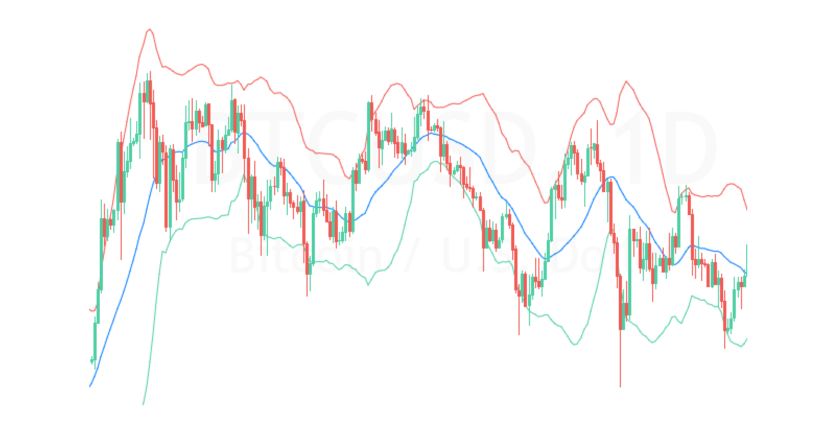
Bollinger Bands (BB) help traders understand the magnitude of the present market volatility, based on past price movements. For that reason, like in the example below (BTCUSD, 1D chart), you can place your Stop-Loss above the red (upper) band for short trades or below the green (lower) band for long trades. Remember that if you use a BB-based model, you must close your trades as soon as the price reaches the opposite band.
The other volatility indicator is the ATR. It helps determine the average price movement of an asset. To place a Stop-Loss using ATR, you must:
- Calculate the current ATR value (e.g., 14-period ATR).
- Multiply it by a risk factor (typically between 1.5x and 3x ATR).
- Subtract (for long positions) or add (for short positions) the ATR-based distance from the entry price. This ensures stops are placed based on market volatility rather than arbitrary points.
For example, if you are looking for longs on silver (XAGUSD), with an entry point at 32.39500 and the ATR shows a value of 0.16300, you:
- Calculate the current ATR: 0.16300
- Multiply it by a risk factor of 2x: 0.32600
- Subtract (for long positions) the ATR-based distance from the entry price: 32.39500 - 0.32600 = 32.069.
32.069 is the level where to place your Stop-Loss.
Conclusion
Placing a Stop-Loss effectively is more than just picking a random price level. By incorporating volatility measures like ATR, technical levels provided by price structure, and dynamic trailing stops obtained through MAs and Parabolic SAR, traders can enhance risk management while staying in profitable trades longer. The key is to remain adaptive – markets change, and so should your Stop-Loss strategy.
Discover the latest Headway updates on Telegram, Facebook, and Instagram.


