Renko Charts: Filtering Noise to Spot Clear Forex Trends


In the world of Forex trading, where volatility and price noise often obscure the true trend, Renko charts offer a refreshing alternative to traditional candlestick or line charts. Let’s find out what they are and how to use them in trading.
What are Renko charts?
Derived from the Japanese word “renga,” meaning brick, Renko charts use fixed price movements instead of time-based intervals to build their structure. This allows traders to focus purely on price action and identify clearer trend signals.
Unlike traditional charts that form a new candle or bar at regular time intervals (like every minute or hour), Renko charts only form a new "brick" when the price moves by a predefined amount. This unique feature helps to filter out market noise and gives traders a cleaner view of the trend.
How Renko charts work
Each Renko brick is created only when the price moves a certain number of pips (for example, 10, 50, or 100 pips), depending on the trader’s settings. If the price moves in the same direction by the brick size, a new brick is added in that direction. If the price reverses by at least the brick size, a new brick is drawn in the opposite direction.
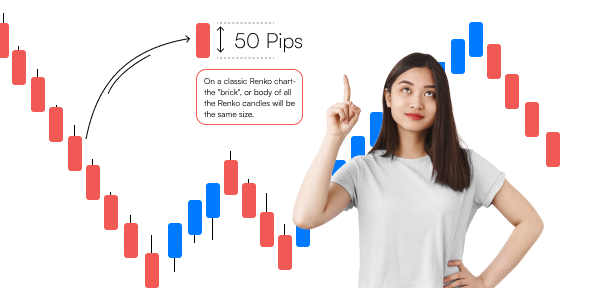
So, if you set the brick size to 50 pips:
- A new bullish (white or green) brick forms only when the price rises by 50 pips from the last brick.
- A new bearish (black or red) brick forms when the price drops 50 pips below the last brick.
Because time is not a factor in forming bricks, Renko charts may show fewer data points but more meaningful signals.
Benefits of using Renko charts in Forex
Noise reduction
The primary advantage of Renko charts is their ability to eliminate price noise. Since small fluctuations that do not meet the brick threshold are ignored, traders get a much smoother and more consistent representation of price trends.
Trend clarity
Renko charts shine when identifying trends. Unlike candlesticks, which often show back-and-forth wicks and false signals, Renko charts only show movement when the market truly advances. This makes spotting higher highs and lower lows easier.
Easy support and resistance levels
Support and resistance levels become more evident with Renko charts, as horizontal zones where bricks repeatedly reverse direction are highlighted without the distraction of intraday noise.
Better entry and exit signals
Renko-based strategies can help traders enter trades in the direction of the trend and exit when a clear reversal occurs. They are especially helpful in trend-following systems where timing the reversal is key.
How to use Renko charts in Forex trading
Trend following
A simple trend-following strategy is to go long (buy) when a new bullish brick forms after a series of bearish ones, and to go short (sell) when a new bearish brick follows a bullish series. This helps confirm a potential reversal or continuation.
Combining Renko with indicators
While Renko charts are powerful on their own, many traders combine them with indicators like:
- Moving Averages crossovers are easier to see on Renko.
- RSI helps confirm overbought/oversold conditions.
- MACD can validate trend strength and direction.
- ATR is often used to determine optimal Renko brick size.
Breakout strategies
Renko charts can be ideal for breakout traders. When price forms a series of bricks in one direction after consolidating, it may signal a breakout from a key level. Traders often use horizontal lines to mark zones of accumulation or congestion and trade the break with more confidence.
Renko chart strategies for Forex
Strategy 1: Renko Moving Average cross
- Add two EMAs (e.g., 10 EMA and 21 EMA);
- Buy when 10 EMA crosses above 21 EMA, and a bullish brick forms;
- Sell when 10 EMA crosses below 21 EMA, and a bearish brick forms;
- Exit when the opposite crossover occurs or when the price hits a Stop-Loss or target.
Strategy 2: Renko reversal at support/resistance
- Identify major support/resistance zones;
- Wait for a price reaction at these zones;
- Enter when the first opposite-colored brick forms;
- Add confirmation from RSI or MACD for stronger signals.
Strategy 3: Trendline breakouts
- Draw diagonal trendlines across Renko bricks.
- When a brick closes beyond the trendline, it could signal a breakout.
- Use a Stop-Loss below the last brick and target based on risk/reward ratio.
Limitations of Renko charts
While Renko charts are great for trend clarity, they do come with some limitations:
- Lagging nature. Because Renko bricks form only after a price moves a set amount, there’s an inherent lag. This means traders might miss the initial part of a move.
- No time information. Renko does not show how long a trend lasted or how quickly it formed. This can be a drawback for scalpers or time-sensitive strategies.
- Whipsaws in choppy markets. In ranging or indecisive markets, Renko can still produce whipsaws, especially if the brick size is too small.
Conclusion
Renko charts offer a simplified, noise-free way to view Forex price action. For traders overwhelmed by the constant flicker of candlesticks or struggling to find consistent trend entries, Renko provides a visual edge.
While they may lag slightly and are not suited for scalping, Renko charts can dramatically enhance trend-following and breakout strategies when paired with sound risk management.
Discover the latest Headway updates on Telegram, Facebook, and Instagram.


