The World of Chart Patterns: Continuation Patterns


When traders think of technical analysis, candlestick patterns often come to mind first. While these short-term signals are valuable, they are just one piece of a much larger puzzle.
Beyond individual candlestick formations lies a broader realm of chart patterns – structured price movements that provide insight into market trends, momentum shifts, and potential reversals.
In this article, we will explore the most important continuation chart patterns, how they work, and why they remain a cornerstone of technical analysis for both novice and professional traders alike.
Continuation patterns and candlestick patterns
Continuation patterns indicate that the current trend is likely to persist after a temporary consolidation. These formations suggest that traders are pausing before continuing in the same direction.
They all share the same mechanics: Price moves inside a figure and then breaks out. Often, breakouts coincide with candlestick patterns, which contribute to validating the signals they give.
Key continuation patterns
There are three most important types of continuation patterns:
1. Triangles (ascending, descending, symmetrical)
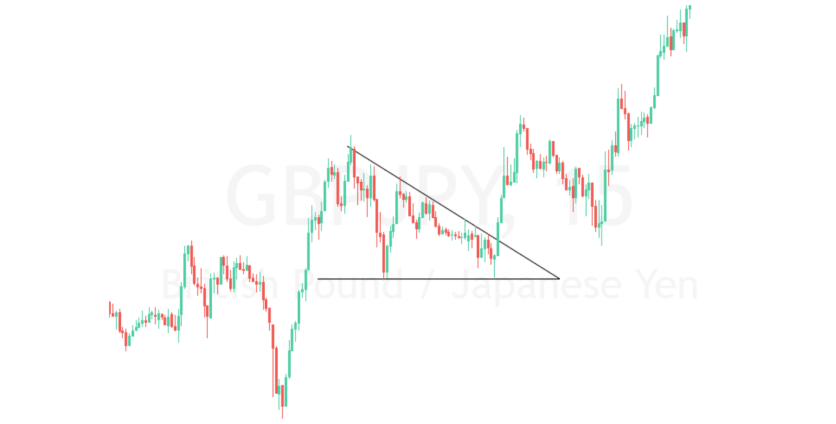
Triangles are some of the most common continuation patterns and signify a period of consolidation before a breakout.

Triangles can be found in every timeframe and in every asset you want to trade. Ascending or descending ones are the easiest to trade, as they give a stronger continuation signal.
However, as shown in the example below, a trader should wait for a breakout and a retest of the structure before blindly jumping in. In this GBPUSD 15M descending triangle pattern example, the price broke out to the upside. After a brief retest of the breakout zone, it proceeded bullishly.
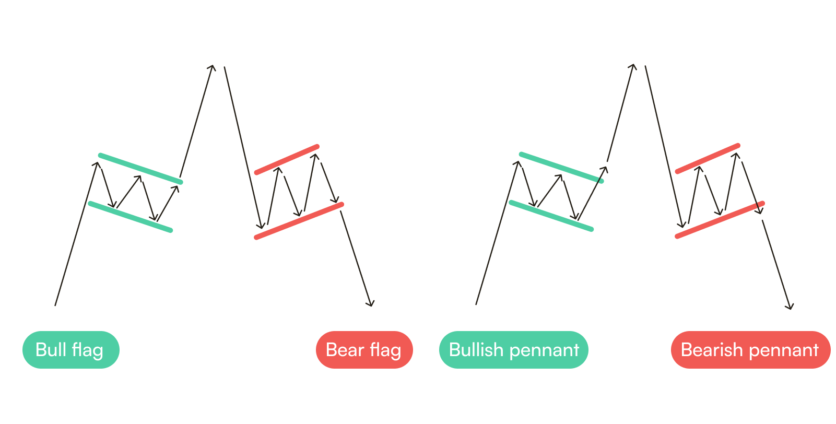
2. Flags and pennants
These short-term patterns represent brief pauses in a strong trend. They are more common than triangles, especially in currency pairs that present strong momentum movements, like USDJPY.
Here’s how you could have profited from a flag pattern while trading the Ninja currency pair:
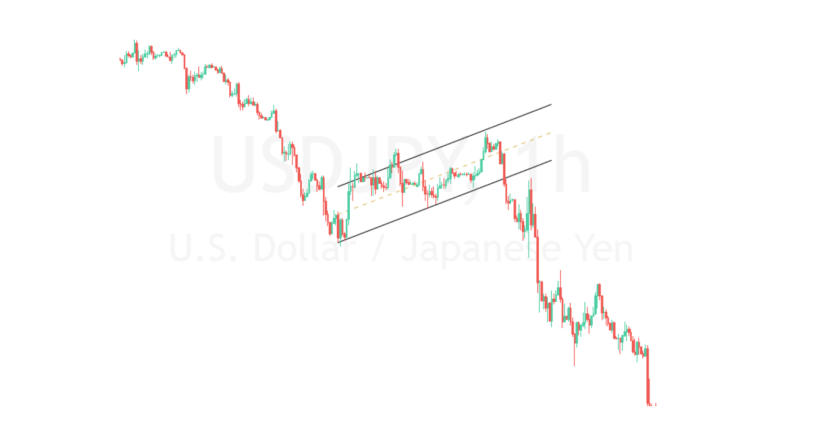
As you can see, the trend was strongly bearish. Then a bearish flag formed. After breaking out to the downside, the price tried to retest it before continuing bearish again.
3. Rectangles
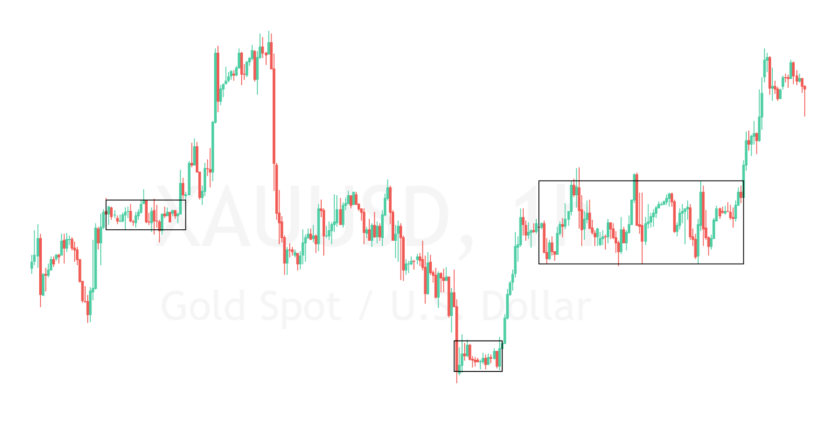
A rectangle forms when the price moves within parallel support and resistance levels before breaking out in the direction of the prevailing trend. At least, in theory. It reflects a period of indecision before the market comes up with its next direction.
A rectangle pattern is a simplified conceptualization of the “range” or “consolidation” phase of the market. Because a range can be not only an accumulation but also a distribution, sometimes the rectangle becomes a reversal pattern.

In the image below, you can see that rectangles can be not only a continuation pattern but also a reversal one. It is difficult to grasp what will happen before the price finally breaks out of the range. However, there is a method that can help you predict more accurately where to expect the breakout.
Conclusion
While continuation patterns are not mistake-proof and require proper risk management and thorough analysis, they can offer valuable insight and provide key entry points.
By combining these patterns and candlestick patterns, a very powerful trading method emerges. Trade when price breaks out of these figures in the direction of the main trend, and you can rest assured – you will become a profitable trader.
Discover the latest Headway updates on Telegram, Facebook, and Instagram.


