

Unlike continuation patterns, reversal patterns suggest that the existing trend is losing momentum and may soon reverse. Identifying these formations can help traders position themselves ahead of major market shifts. In this article, we will explore the main reversal formations and how to spot and profit from them.
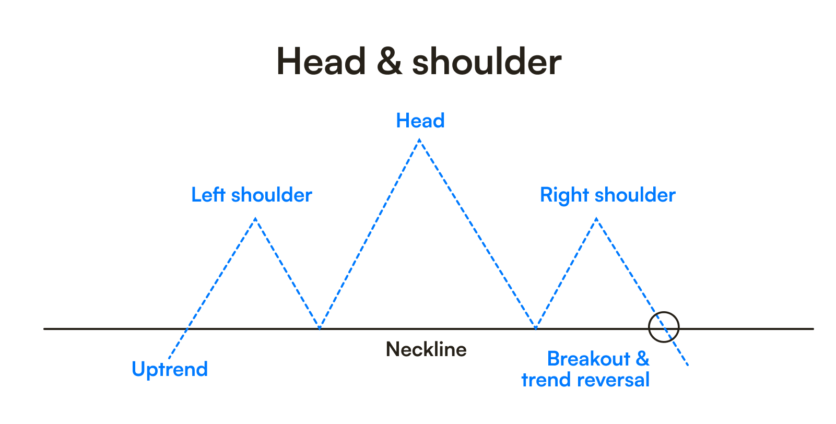
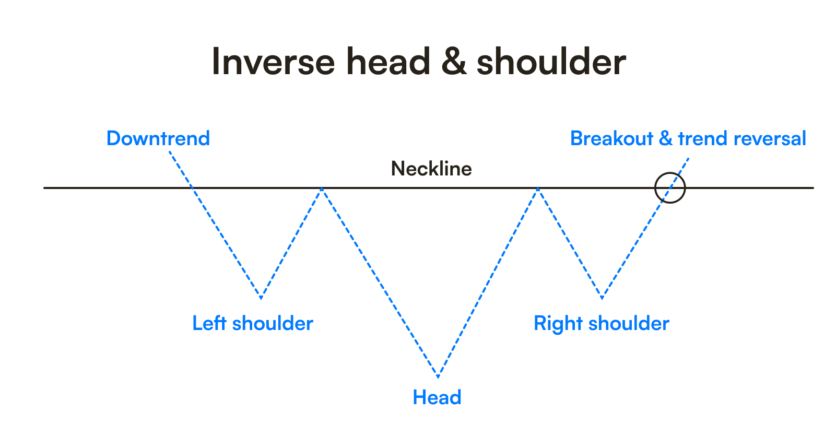
One of the most reliable reversal patterns, the Head and Shoulders, signals a trend change. There are two types of the Head and Shoulders pattern:
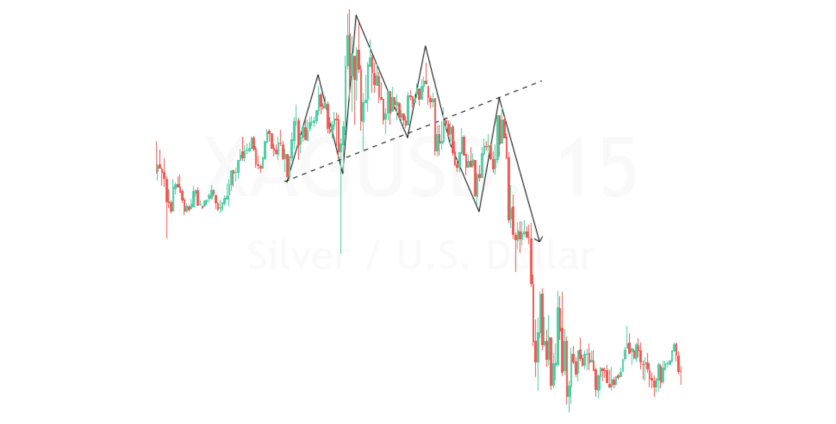
On the chart below, we can find a standard Head and Shoulders pattern, which formed on a silver (XAGUSD) 15M chart. As you can see, the schematics are not always followed exactly as drawn. In this example, the neckline is inclined upwards, and the right shoulder is higher than the left one. Also, a lot of volatility occurred, creating long wicks.
Nevertheless, it is a valid Head and Shoulders. When price broke out through the neckline, it stopped, came back to retest it, and only then proceeded to a quick fall.
These patterns indicate that a trend is close to exhaustion and a potential reversal is on the horizon. It is basically the same pattern, but inverted, based on the scenario we find it in.
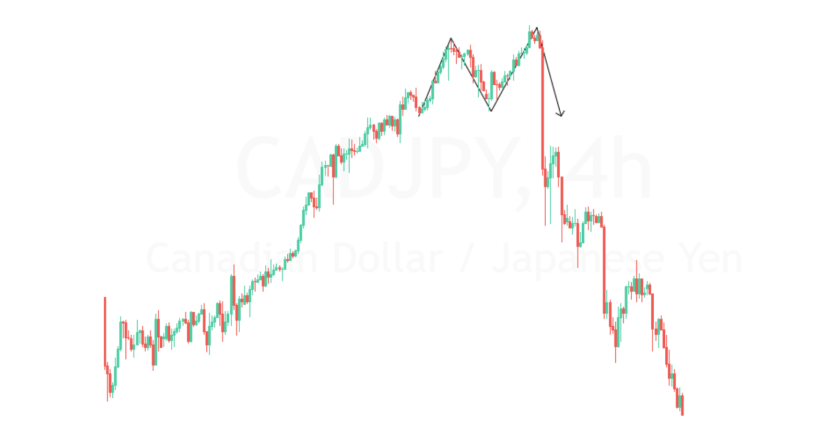
The double top can be seen as a Head and Shoulders pattern without a head. The same is true for the double bottom, which can be intended as a headless inverted Head and Shoulders pattern.
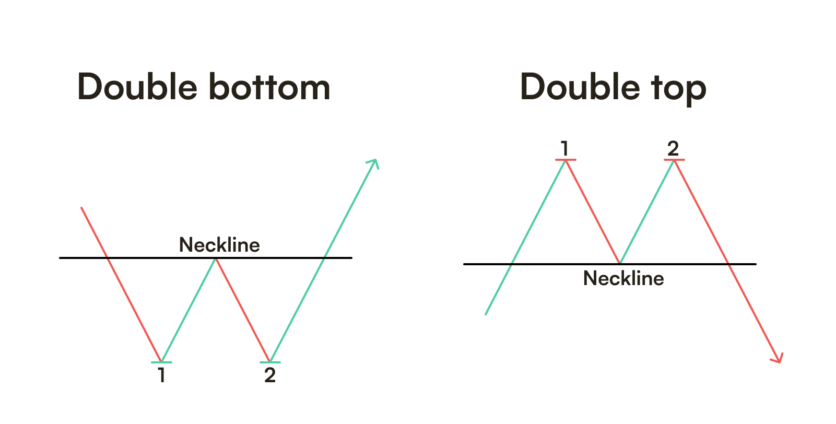
In other words:
This pattern can be found more often than its headful variation, and for that reason, is not always reliable for locating reversal points. In any case, most of the time it signals just that, like in this CADJPY 4H chart below.
There is also a more complex variation of the Double Top/Bottom – the Triple Top/Bottom. It is a Head and Shoulders pattern, where the head is at the same level as the shoulders. The principles to trade the Triple Top/Bottom are the same as for the Top/Bottom.
This pattern signals a trend exhaustion, by showing that the leading part of the market has run out of steam to support the current momentum. It also has two major types: one bullish and the other bearish.
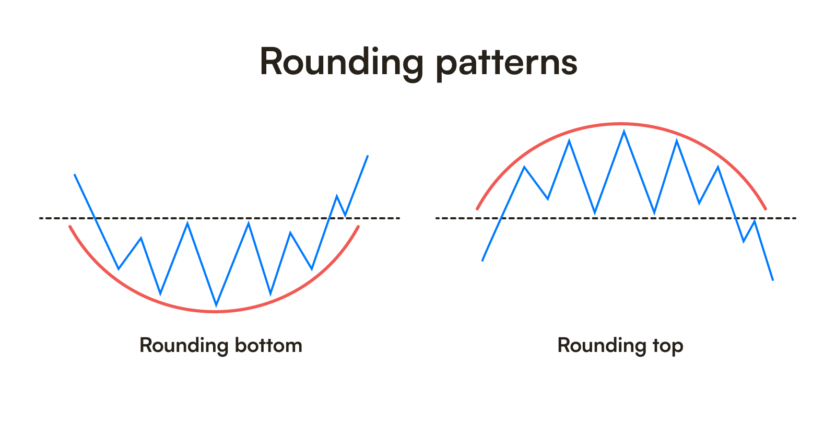
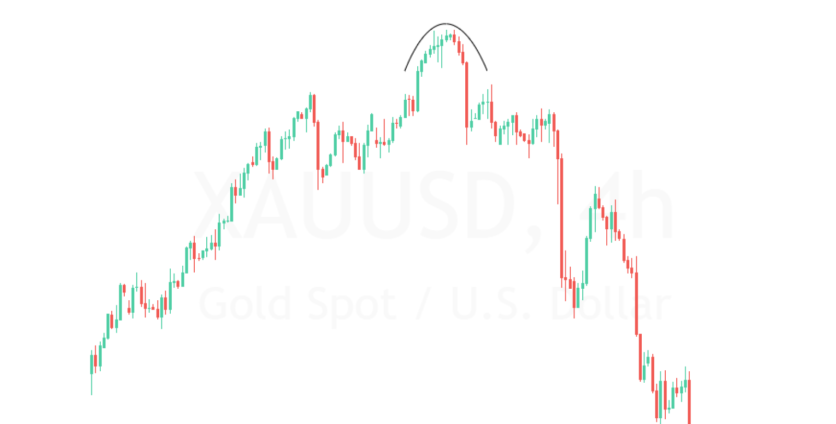
The Rounding Top and Bottom are perhaps the most insightful reversal patterns of all because they combine momentum and market sentiment. When you spot a rounding formation, you can almost surely place your orders against the current trend.
This was the case with gold, just after reaching its ATH on October 30, 2024. As you can see, the fall that followed was quick and brutal (also supported by the election of Donald J Trump for President of the USA).
Top and bottom reversal chart patterns provide traders with essential clues about market behavior, offering insights into when a trend is likely to reverse. Mastering these formations enables traders to improve their decision-making, identify potential trade opportunities, and manage risk more effectively.
Whether navigating bullish or bearish markets, understanding chart patterns is a fundamental skill for any serious trader.
Discover the latest Headway updates on Telegram, Facebook, and Instagram.


