Why the Yield Curve Reflects Human Expectations


At first glance, the yield curve appears to be just a line on a graph plotting interest rates of bonds with different maturities. But dig deeper, and you’ll discover it’s actually a profound reflection of how humans perceive the future. This is the economics of time: How we value money not just in the present, but across time. And the yield curve is its most elegant representation.
What is the yield curve?
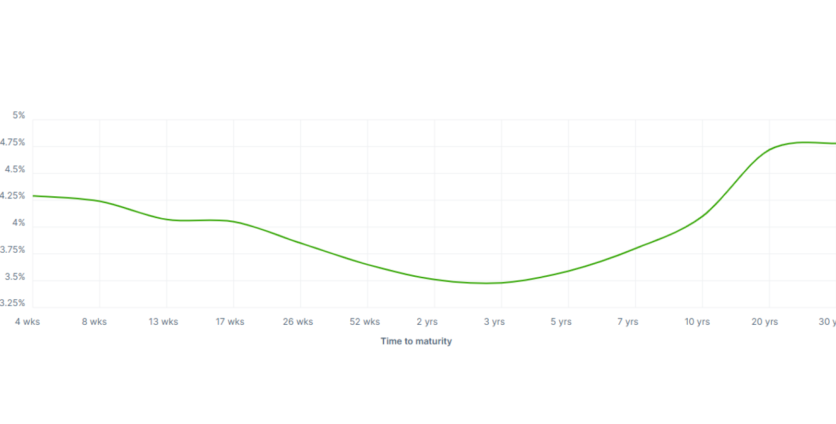
Let’s start with the basics. The yield curve plots the interest rates (yields) of government bonds (typically US Treasuries) at different maturities, ranging from a few months to 30 years. Each point on the curve represents what the market demands as compensation for lending money for that specific amount of time.
There are three main types of yield curve shapes:
- Normal yield curve. Long-term yields are higher than short-term yields. This implies optimism about future growth and a healthy economic environment.
- Flat yield curve. Yields across all maturities are roughly the same. This often signals uncertainty.
- Inverted yield curve. Short-term yields are higher than long-term yields. This rare phenomenon is frequently interpreted as a warning sign of recession.
But these shapes don’t just happen at random. They reflect the dynamic interplay of expectations among millions of market participants.
Time preferences and human behavior
To understand why the yield curve matters, we need to talk about time preference – a fundamental concept in economics. Humans generally prefer receiving something now rather than later. In financial terms, this is called the time value of money.
If you’re going to lend money for a longer period, you naturally want to be compensated for the risk of inflation, uncertainty, and opportunity cost. That’s why longer-term bonds usually offer higher yields – investors are asking to be paid for waiting.
But it’s not just about risk. It’s about expectations. When investors believe the future will be better – higher growth, rising interest rates, or strong inflation – they demand higher yields on long-term bonds. When they think trouble is ahead, they seek safety in long-term government debt, driving yields lower. This causes the yield curve to flatten or even invert.
The yield curve as a forecasting tool
Economists and central banks pay close attention to the yield curve because of its predictive power. The most talked-about signal is the inverted yield curve, when short-term rates are higher than long-term ones.
Historically, an inversion of the US Treasury yield curve has preceded nearly every major recession in the last 70 years. Why? Because it means investors believe that interest rates and economic activity will decline in the future.
When central banks raise short-term rates to combat inflation, borrowing becomes more expensive. If investors believe these rate hikes will slow the economy too much, they pile into long-term bonds, pushing those yields down. The result: an inversion.
Inflation expectations are key
One of the biggest influences on the yield curve is inflation. If investors believe that inflation will be high in the future, they demand higher yields to compensate for the erosion of purchasing power.
On the other hand, if they expect inflation to fall or if they fear deflation, they’re willing to accept lower yields, especially on long-term bonds.
This is why inflation expectations are embedded in the curve. Central banks, especially the Federal Reserve, closely monitor this because inflation targeting is a core part of their mandate.
Central Banks and the short end of the curve
Central banks primarily influence short-term interest rates. When the Federal Reserve raises or lowers the federal funds rate, it directly impacts yields on short-term bonds.
But the long end of the yield curve is driven more by the market’s view of future growth, inflation, and monetary policy. This creates a kind of dialogue between the Fed and the market, where the Fed signals its intentions, and the market reacts based on how credible or effective those intentions are believed to be.
In that way, the yield curve becomes a marketwide sentiment barometer blending the voice of policy with the emotion of the crowd.
Real-world example: The 2008 financial crisis
In the years leading up to the 2008 crisis, the yield curve began to flatten and eventually invert, warning that something was wrong. While equity markets surged, the bond market, often considered “smarter” than the stock market, was quietly signaling danger.
When the housing bubble burst, the bond market's message became clear: The expectations of lower growth and falling interest rates were correct. The Fed responded by slashing rates, but the yield curve had already told us what was coming.
Real-world example: Post-COVID rebound and inversion (2022–2023)
After the initial shock of the COVID-19 pandemic in 2020, the economy rebounded sharply. By 2022, inflation surged to levels not seen in decades. The Fed responded with aggressive rate hikes, lifting short-term interest rates quickly.
Long-term yields rose too, but not as fast. By mid-2022, the yield curve began to invert again. Investors were already pricing in that the Fed’s aggressive tightening might eventually slow the economy, or even push it into recession.
Once again, the curve reflected more than numbers – it reflected human expectations of pain, caution, and future rate cuts.
Conclusion
The yield curve is far more than a financial instrument. It’s a mirror of market psychology, a chart of how humans think about time, uncertainty, and opportunity. Each shift in the curve is the result of billions of dollars reacting to trillions of thoughts about jobs, prices, wars, policies, and dreams.
So the next time you see that simple line on a screen, remember: it’s not just economics. It’s a story. A story about time, risk, and how we imagine the future.
Discover the latest Headway updates on Telegram, Facebook, and Instagram.


